Since its inception in 1996, social media has reached more than half of the world’s population.
Social network platforms’ total user base in the last decade grew from 970 million in 2010 to 5.41 billion users in July 2025.
The spectacular year-on-year adoption of new users on the platforms is, however, slowing down. It now relies on the continuous growth in the number of people with internet access and smartphones, particularly in developing regions.
So, how big is social media, and how has it evolved today?
Social Media Usage Statistics (Top Picks)
- 5.41 billion people currently use social media worldwide – over double 2015’s 2.07 billion.
- The average social media user engages with an average of 6.83 various social media platforms.
- 68.5% of the global population uses social media.
- The average person spends 2 hours 21 minutes on social media per day.
- Facebook is the leading social network with 3.07 billion monthly active users.
- 73% of the US population actively uses social media.
How Many People Use Social Media?
As of July 2025, over 5.41 billion people use social media.
The average user accesses 6.83 social media platforms monthly.

All social networks report growth data on the number of monthly active users (MAUs) rather than the number of accounts, as this data is more accurate for measuring actual use and territory penetration.
What Percentage of People Use Social Media?
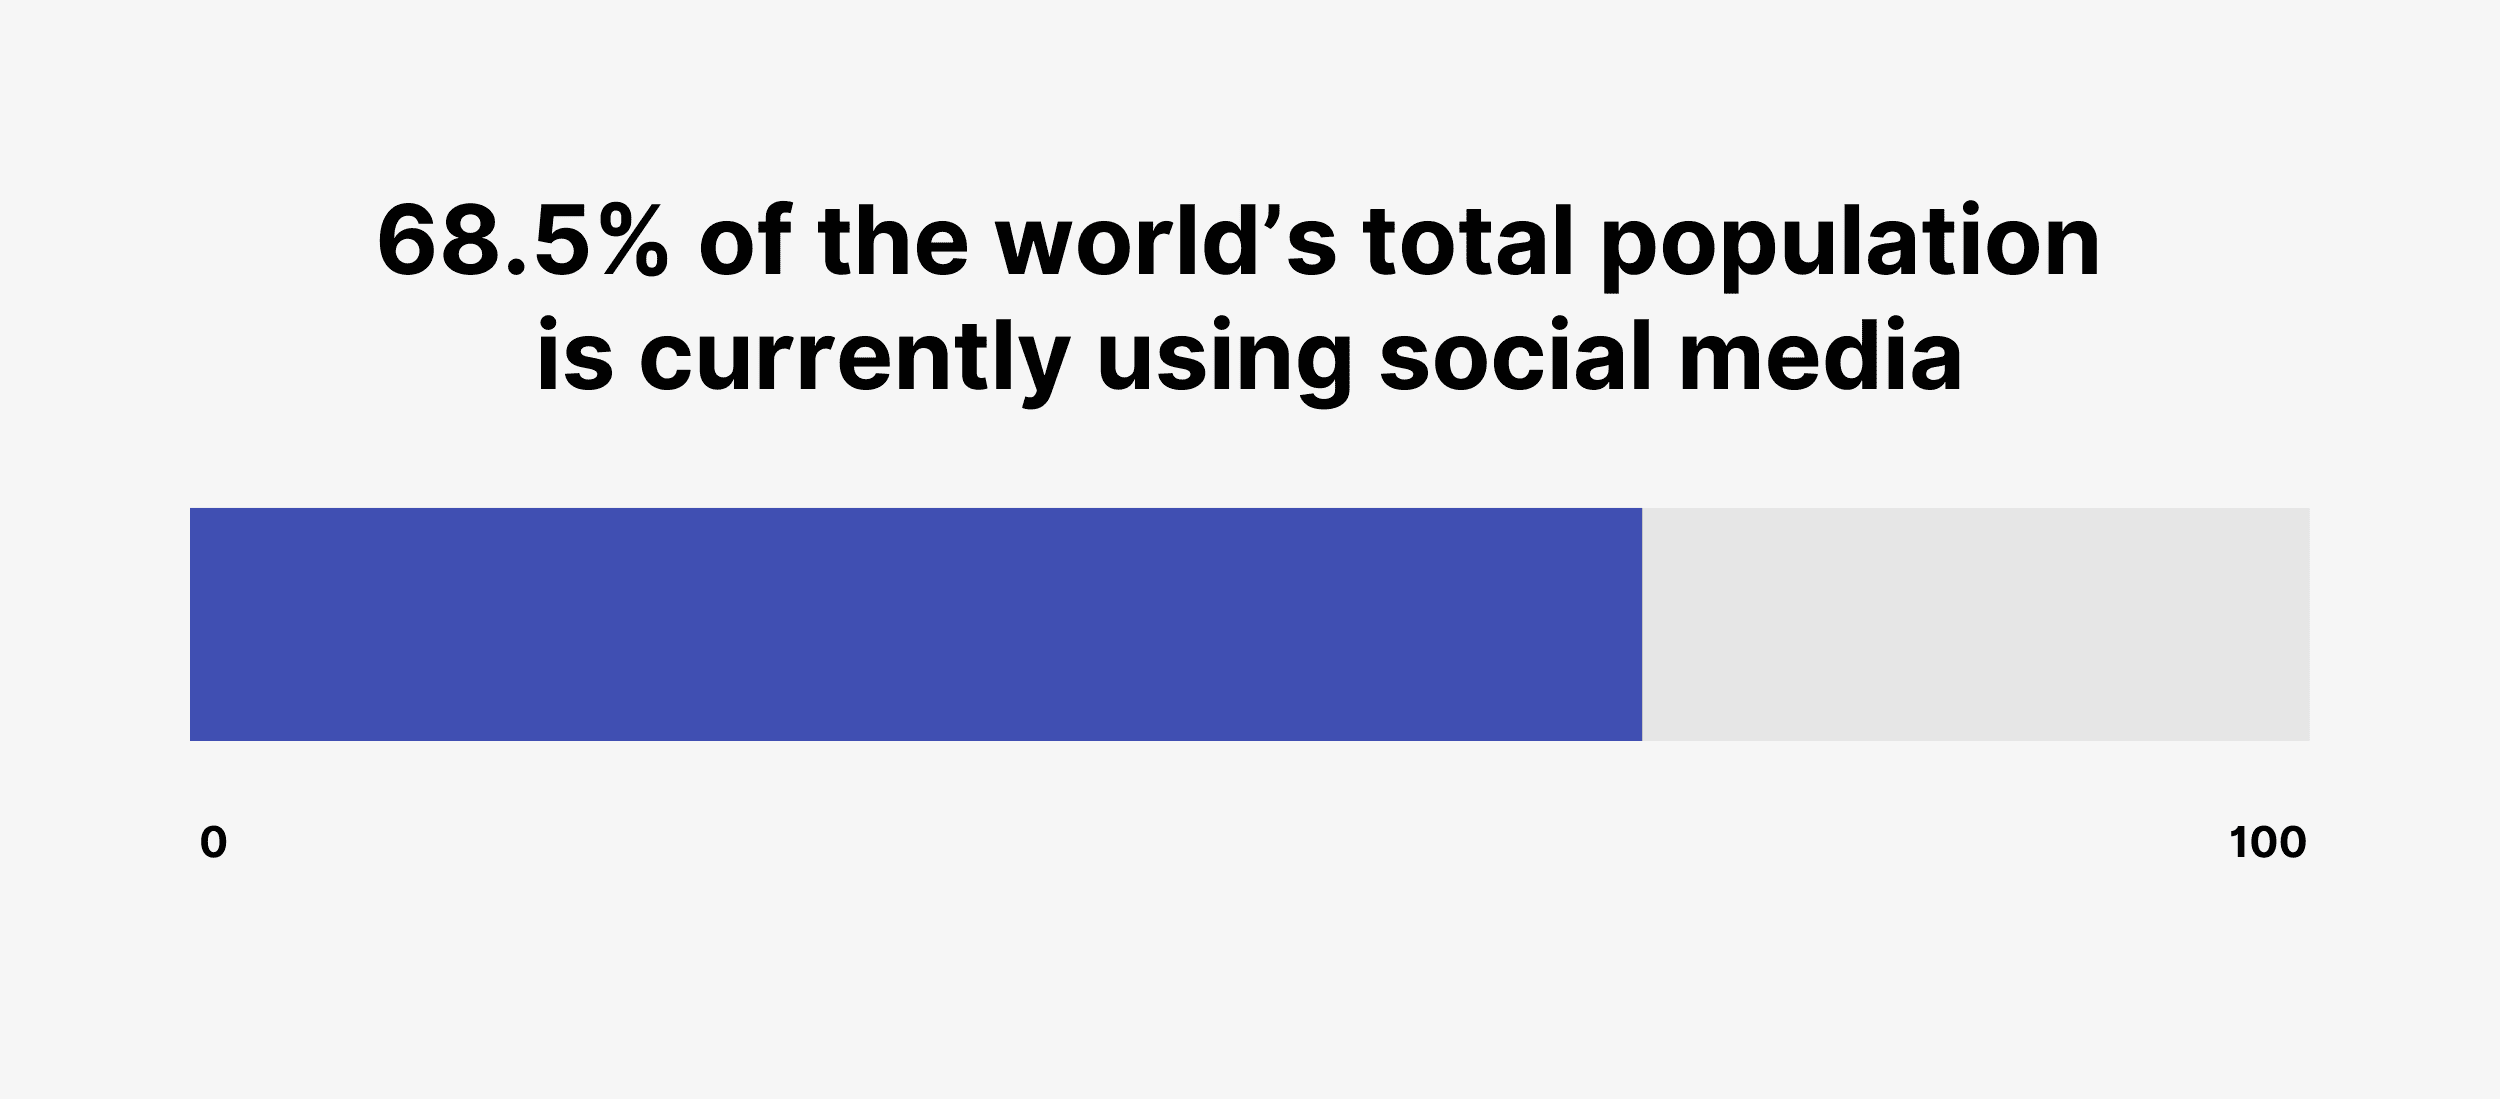
The current percentage of people using social media is 68.5% of the world’s total population.

However, when we look into platform penetration rates from people in eligible audiences, that figure is approximately 95.58% of the 5.66 billion global internet users.
Key Statistics:
- 5.24 billion people use social media worldwide, according to platform reports on the current number of active users.
- 86.6% of the world’s population is active on social media when looking at eligible audiences aged 18+ years.
- 68.5% of the global population uses social networks, regardless of age or internet access.
- Out of 5.66 billion internet users, 95.58% are active users.
How Many Social Platforms Does the Average Person Use?
According to the Global Web Index, global users aged 16+ access an average of 6.83 social media platforms each month.

That rises up to 7.71 platforms among audiences aged 16-24 years old.
A study of 53 countries shows that Japan averages the lowest number of social platforms used at 2.49. By comparison, the UAE has the highest with 8.62 per internet user.
5 Key Highlights:
- Brazil – 8.05 social media platforms per internet user
- India – 7.75 social media platforms per internet user
- US – 6.48 social media platforms per internet user
- UK – 6.14 social media platforms per internet user
- Japan – 3.49 social media platforms per internet user
How Many People Use Social Networks for Business?
38.3% of all internet users worldwide use social media for work purposes.

In the US, only 25.4% of the population actively uses social media in their jobs.
Looking at the extremes, 65.2% of Nigerians use social media for work, while just 8.3% do so in Japan.
5 Key Highlights:
- Brazil – 50.2% of people use social media for work
- India – 41.2% of people use social media for work
- USA – 26.5% of people use social media for work
- UK – 25.4% of people use social media for work
- Japan – 8.3% of people use social media for work
Social Media Usage by Gender
The current global average gender split of social media users is 54.6% men versus 45.4% women.
Which gender uses social media more by region?
- North America: 50% female vs. 50% male users
- South America: 52% female vs. 48% male users
- Western Europe: 50% female vs. 50% male users
- Southern Africa: 49% female vs. 50% male users
- Southern Asia: 34% female vs. 66% male users
- South-Eastern Asia: 49% female vs. 51% male users
- Oceania: 50% female vs. 50% male users
Which gender uses social media more by platform?
As you can see from the data above, social network usage is different for men and women globally when examining location. Perhaps the most notable gap in gender differences is when we look at the use by platform.

When looking at the top 8 social platforms, most index higher in male users. Pinterest dominates with female audiences.
| Social Network | Share of Female Users Aged 18+ (vs. Total Platform Ad Reach Aged 18+) | Share of Male Users Aged 18+ in the US (vs. Total Platform Ad Reach Aged 18+) |
|---|---|---|
| 43.3% | 56.7% | |
| YouTube | 46.0% | 54.0% |
| 47.3% | 52.7% | |
| TikTok | 44.3% | 55.7% |
| 43.1% | 56.9% | |
| Snapchat | 48.4% | 50.7% |
| X (Twitter) | 36.3% | 63.7% |
| 70.3% | 22.4% |
Source: DataReportal, DataReportal (2), Worldometer
Global Social Media Growth Rates
How Much Does Social Networking Grow Year on Year?
In 2025, there are 5.24 billion people actively using social media in the world, and this is an increase of 4.1% year-on-year from 5.04 billion in 2023.

Back in 2015, there were only 2.08 billion users – that’s a 2.52x increase in a decade.
10-Year Social Media Growth Statistics:
- 2025: 5.24 billion active users (+4.1%)
- 2024: 5.04 billion active users (+5.8%)
- 2023: 4.76 billion active users (+3%)
- 2022: 4.62 billion active users (+10%)
- 2021: 4.20 billion active users (+13%)
- 2020: 3.71 billion active users (+7.2%)
- 2019: 3.46 billion active users (+8.3%)
- 2018: 3.20 billion active users (+15%)
- 2017: 2.79 billion active users (+21%)
- 2016: 2.31 billion active users (+11%)
- 2015: 2.08 billion active users
Day One: When Did Social Media Start?
The rise of social media began back in 1996 with the release of the networking site Bolt (now closed).
Shortly after, in 1997, Six Degrees was released, where users could add friends and make profiles.
Following that, services like AOL Instant Messenger, Live Journal, and Friendster launched all paving the way for the leader, Facebook, in 2004.
Timeline: Early Days of Social Media
- 1996: The first social networking and video website was Bolt, which was active from 1996-2007.
- 1997: A site called Six Degrees was created, where users could upload profile information and connect with users by making ‘friends’.
- 1997: AOL launched its Instant Messenger service, which it acquired from an Israeli-based company. It was originally called ICQ and launched in 1996.
- 1999: This was the launch of LiveJournal, the first popular blogging platform.
- 2000: Habbo, a game-based networking site, was released.
- 2002: Friendster launched, where users made profiles, connected, and shared content.
- 2003: LinkedIn launched the first business-oriented social networking site.
- 2004: Facebook, the most popular platform of all time, launched.
Sources: DataReportal, Wikipedia
Social Media Penetration by Country
Which Country Has the Most Active Social Media Users in the World?
Social media penetration = proportion of a population that uses social media platforms.
According to Kepios’ analysis from 2025, the most active country is the UAE, with 100.3% of its population using social media. Due to duplicates and “fake users”, the number of social media users is overcounted and does not necessarily represent unique individuals.
The average adoption rate globally is 63.9%.
Key Statistics
- On average, 63.9% of the world is active on social media, regardless of age.
- On average, 86.6% of the world’s population aged 18+ is active on social media.
- The US has 73% social media penetration, and 81.5% for 18+.
- The UK has 79% social media penetration, and 87% for 18+.
- Canada has 79.4% social media penetration, and 87.8% for 18+.
- Australia has 77.9% social media penetration, and 87.8% for 18+.
- India has 33.7% social media penetration, and 43.1% for 18+.
Social Media in the US by the Numbers
What Percentage of Americans Are on Social Media?
According to recent estimates, the number of active social media users in the US is 253 million in 2025, meaning 74% of Americans are on social media.

Number of Americans on Social Media:
The US social media penetration is calculated by the total number of active social network users versus the total population.
- 74% of the US population has a social media account. That’s 253 million Americans.
US Social Media Use by Gender:
In the US, social media is more prevalent among women, particularly Facebook (78% vs 61%) and Pinterest (51% vs 19%).
Meanwhile, men disproportionately use sites like Reddit (28% vs 20%) and X (25% vs 17%) more.
US Social Media Use by Ethnicity:
The percentage of social media use versus the total population by race for the entire US population is:
- 80% Hispanic
- 77% Black
- 69% White
US Social Media Use by Age:
Unsurprisingly, the percentage of Americans using social media is skewed towards Gen Z and Millennials.
- 84% of those aged 18-29 use social media.
- 81% of those aged 30-49 use social media.
- 73% of those aged 50-64 use social media.
- 45% of those aged 65+ use social media.
Sources: Pew Research, DataReportal
Most Popular Social Media Platforms
What Are the Most Used Social Media Sites Worldwide?
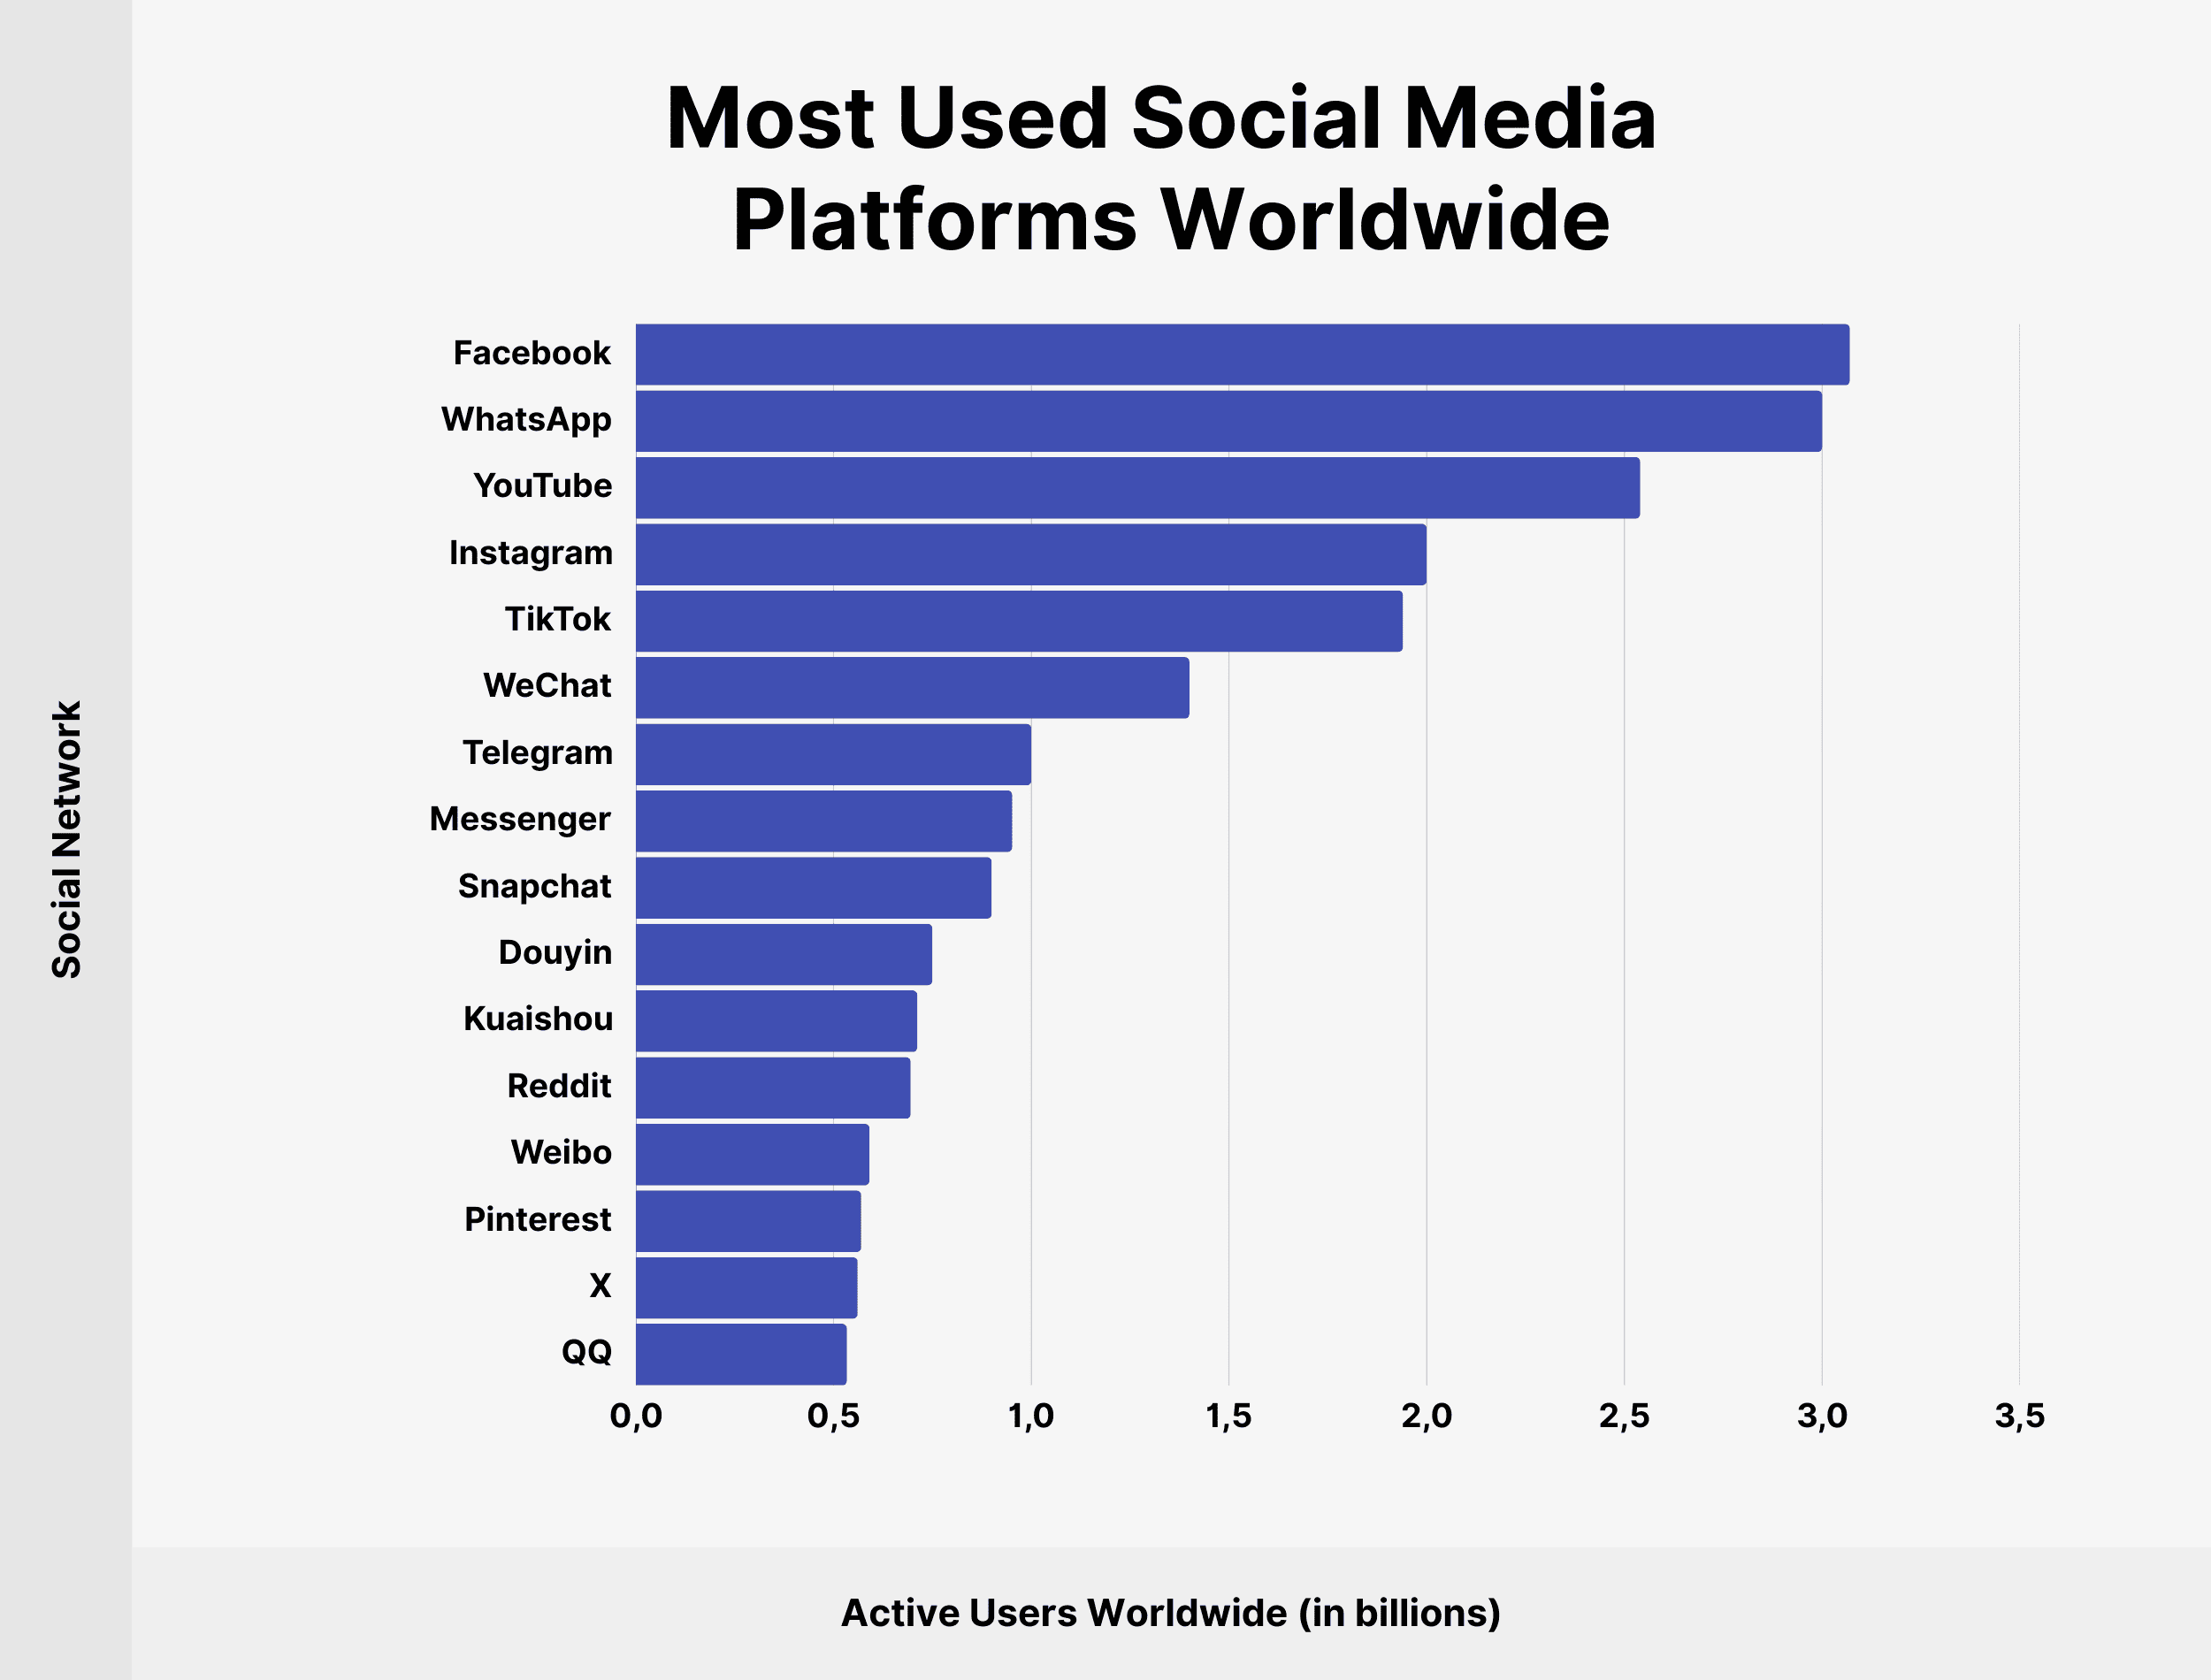
In 2025, Facebook is the leading social network with 3.07 billion active users worldwide.

WhatsApp, YouTube, and Instagram follow this, each with over 2 billion users. TikTok, WeChat, and Telegram all have at least 1 billion users.
| Social Network | Active Users Worldwide |
|---|---|
| 3.07 billion | |
| 3 billion | |
| YouTube | 2.54 billion |
| 2 billion | |
| TikTok | 1.94 billion |
| 1.4 billion | |
| Telegram | 1 billion |
| Messenger | 952 million |
| Snapchat | 900 million |
| Douyin | 750 million |
| Kuaishou | 712 million |
| 695 million | |
| 591 million | |
| 570 million | |
| X | 561 million |
| 534 million |
What Are the Most Used Social Media Sites in the US?
Similar to the global ranking, Meta-owned social networks – Facebook and Instagram lead the ranking with the highest number of monthly active users in the US at 177.5 and 143.3 million, respectively.
| Social Network | Monthly Active Users in the US (in millions) |
|---|---|
| 177.5 | |
| 143.3 | |
| TikTok | 112.1 |
| Snapchat | 91.1 |
| 87.3 | |
| X (Twitter) | 50.5* |
Sources: DataReportal, eMarketer
Average Time Spent on Social Media
How Much Time Do People Spend on Social Media Each Day?
In Q3 2024, the average time spent on social media per day is 2 hours 21 minutes globally for users aged 16+ on any device.

In comparison, the time spent on networks by the average person in the US is 2 hours and 9 minutes. That equates to 12 minutes fewer than the global average.
Key Statistics:
- Globally, the average time a person spends on social media a day is 2 hours 21 minutes / 141 minutes.
- Out of the 53 countries surveyed, people in Kenya spend the most daily time networking at 4 hours and 13 minutes.
- People in Japan spend the least daily time on networking at just 46 minutes.
Time Spent on Social Media by Country
Below, we have the average daily time spent on social media in 10 selected countries according to the Global Web Index.
| Country | Average time spent on social media per day |
|---|---|
| Brazil | 3 hours 32 minutes |
| Philippines | 3 hours 32 minutes |
| Nigeria | 3 hours 23 minutes |
| Indonesia | 3 hours 8 minutes |
| Spain | 1 hour 55 minutes |
| France | 1 hour 48 minutes |
| Italy | 1 hour 48 minutes |
| Canada | 1 hour 46 minutes |
| Germany | 1 hour 41 minutes |
| Japan | 46 minutes |
5 Key Highlights:
- Brazil: 3 hours 32 minutes on social media per day.
- USA: 2 hours 9 minutes on social media per day.
- Australia: 1 hour 51 minutes on social media per day.
- UK: 1 hour 37 minutes on social media per day.
- South Korea: 1 hour 14 minutes on social media per day.
Daily Time on Social Media Growth Statistics
Below, we have a history of the average time spent on social media since 2021.
Data is based on internet users from 53 countries, aged 16 and over, on any device.
| Date | Time (minutes) |
|---|---|
| Q2 2021 | 147 |
| Q3 2021 | 147 |
| Q4 2021 | 149 |
| Q1 2022 | 149 |
| Q2 2022 | 148 |
| Q3 2022 | 151 |
| Q4 2022 | 144 |
| Q1 2023 | 146 |
| Q2 2023 | 144 |
| Q3 2023 | 143 |
| Q4 2023 | 140 |
| Q1 2024 | 140 |
| Q2 2024 | 139 |
| Q4 2024 | 141 |
| Q1 2025 | 141 |
Source: DataReportal
Conclusion
There you have it for our rise of social media statistics roundup.
In terms of technology adoption, it’s mind-blowing to see how quickly social media adoption has grown across the world.
Furthermore, there’s a growing number of new social media networks adding more users.
Backlinko is owned by Semrush. We’re still obsessed with bringing you world-class SEO insights, backed by hands-on experience. Unless otherwise noted, this content was written by either an employee or paid contractor of Semrush Inc.

