Salesforce is the world’s leading cloud-based software provider. It delivers services to more than 150,000 businesses globally.
The company first went public in 2004.
Since then, Salesforce has consistently grown its revenue each year. Annual revenue stands at about $37.9 billion. A 121.63% increase since 2020.
Read on for the latest Salesforce statistics for 2026.
First, here’s a quick overview of the stats you’re about to read:
- Salesforce Annual Revenue
- Salesforce Revenue by Segment
- Salesforce Revenue by Product/Service Type
- Salesforce Revenue by Region
- Salesforce Market Share
- How Many People Work at Salesforce?
Key Salesforce Stats
- More than 150,000 businesses use Salesforce.
- Salesforce generated $37.9 billion in the 2025 fiscal year.
- Salesforce has a 20.7% share of the CRM market.
- 76,453 employees work at Salesforce.
Salesforce Annual Revenue
Salesforce generated an annual revenue of $37.9 billion in 2025. Revenue has increased by 11.2% over the previous fiscal year.
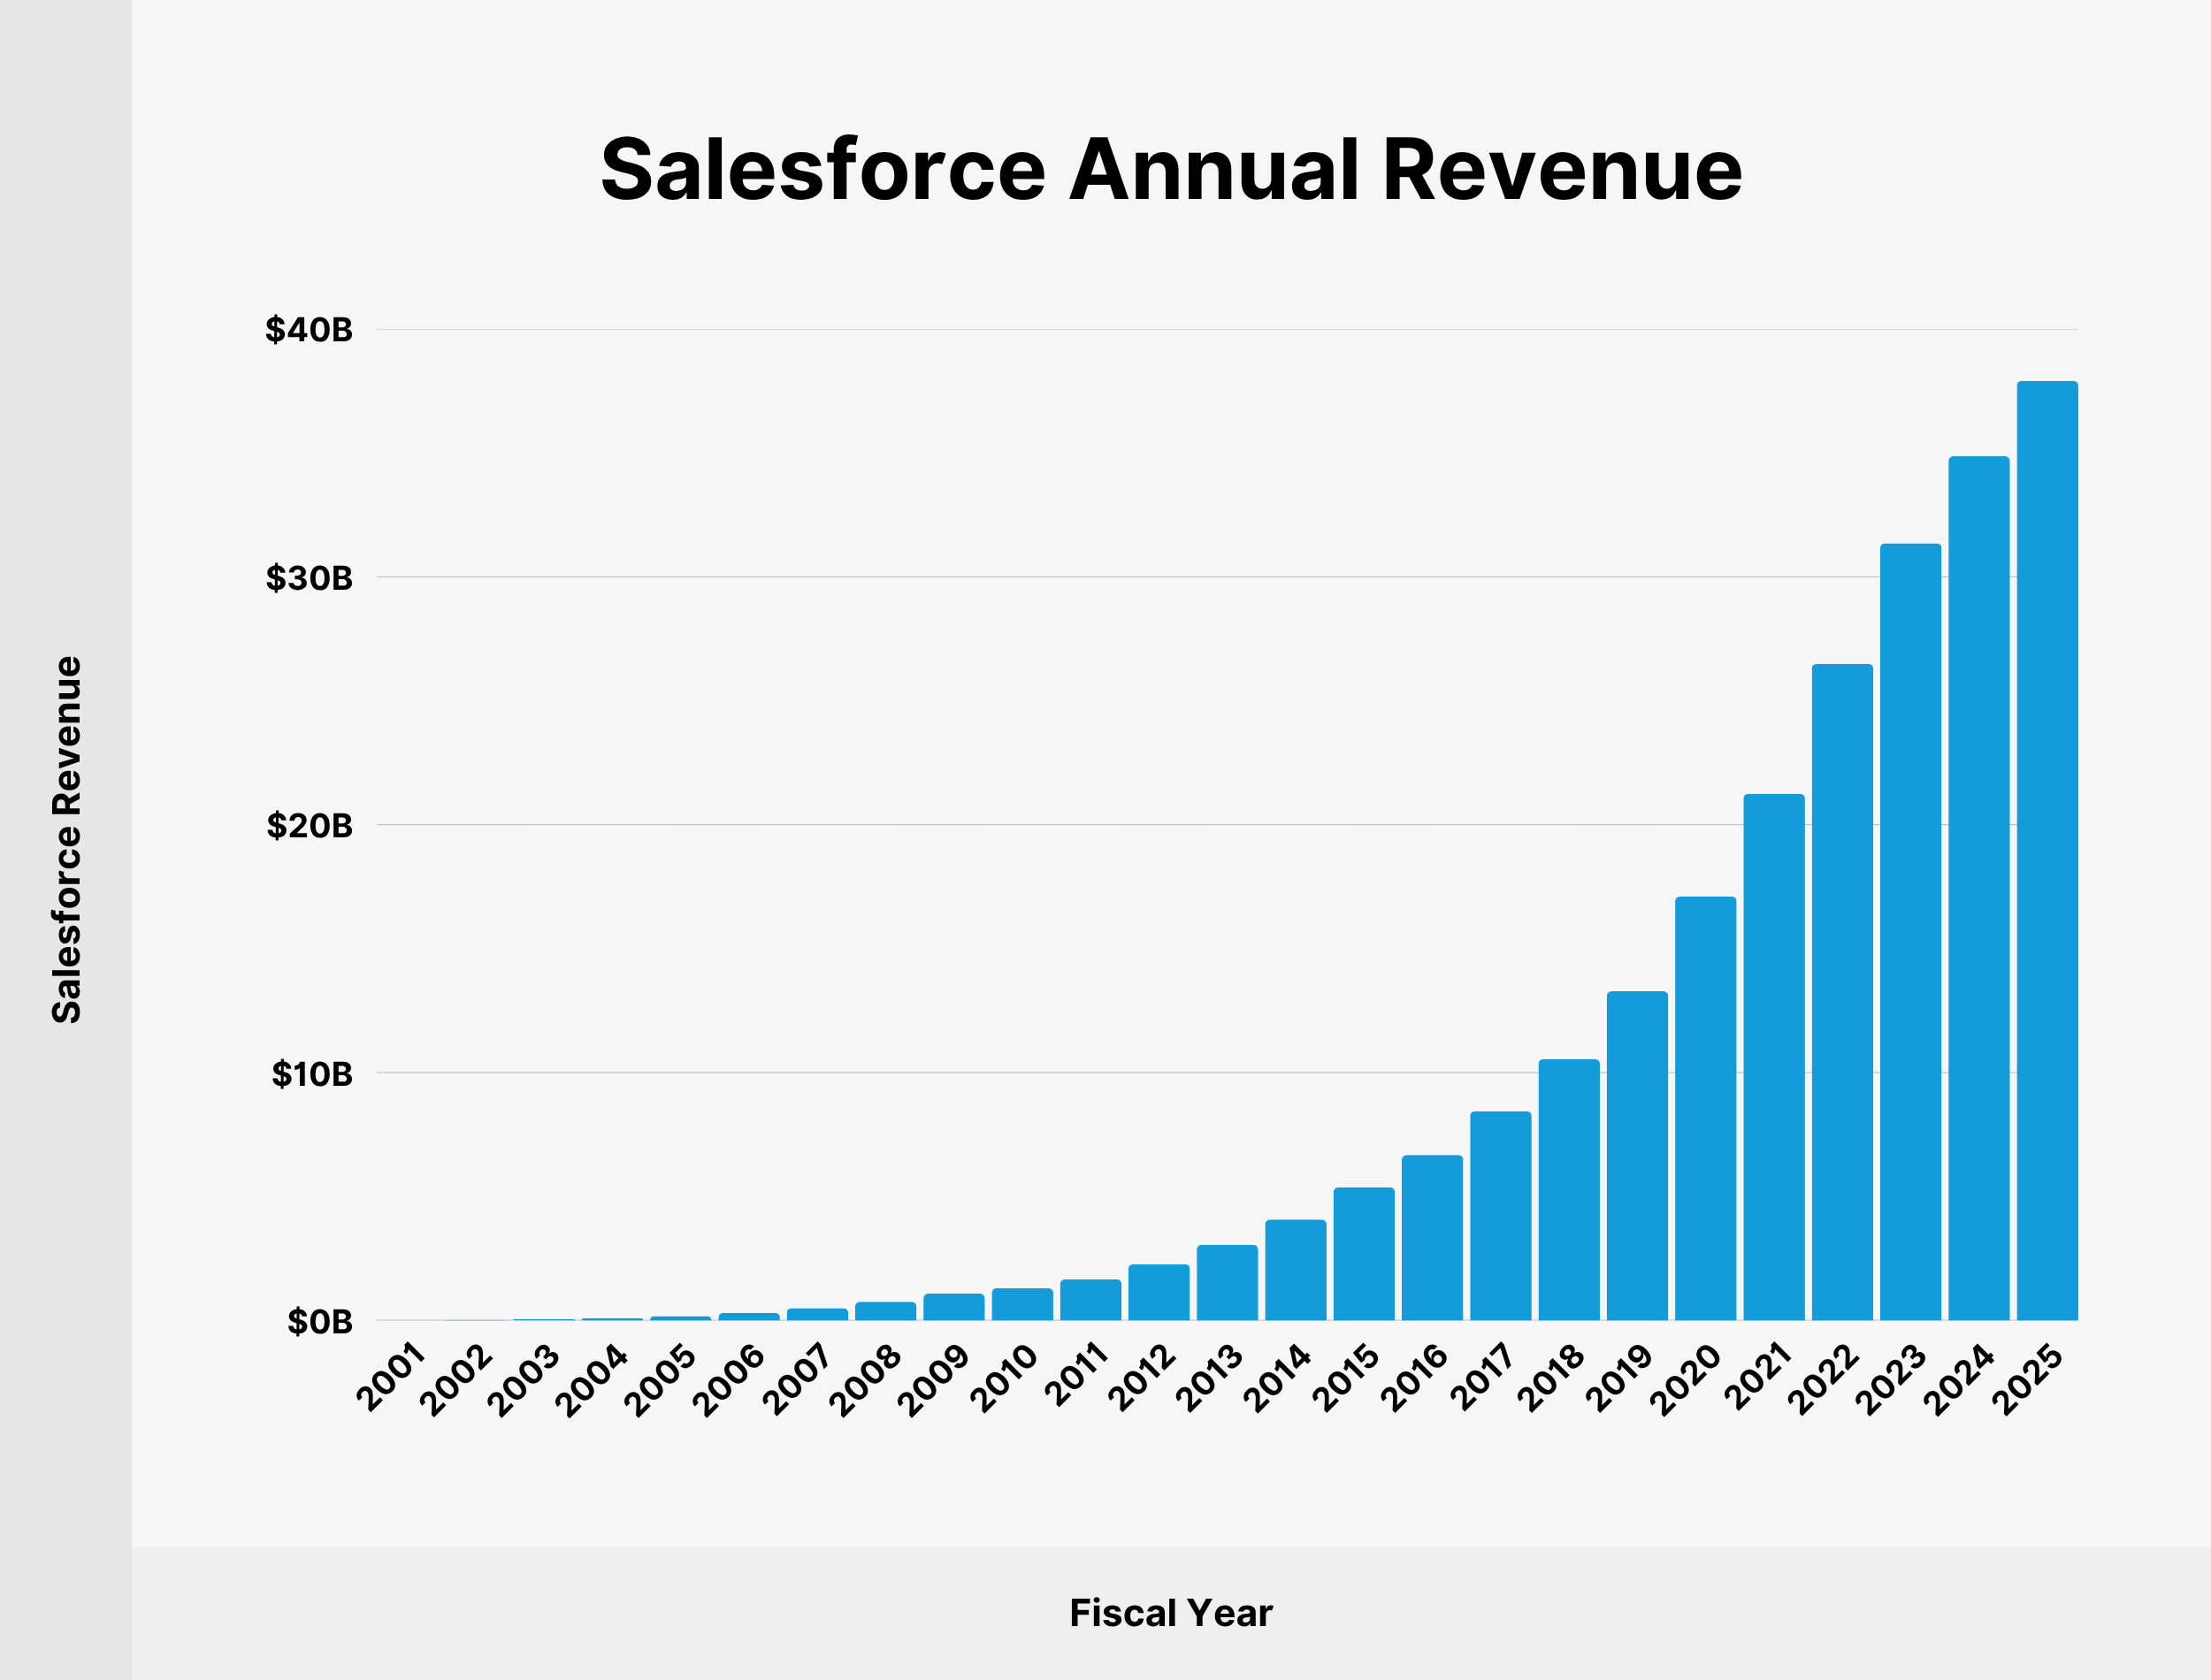
We’ve charted Salesforce’s annual revenue growth since 2001:
| Fiscal Year | Salesforce Revenue |
|---|---|
| 2001 | $5.43 million |
| 2002 | $22.4 million |
| 2003 | $50.99 million |
| 2004 | $96.02 million |
| 2005 | $176.37 million |
| 2006 | $309.86 million |
| 2007 | $497.1 million |
| 2008 | $748.7 million |
| 2009 | $1.08 billion |
| 2010 | $1.3 billion |
| 2011 | $1.66 billion |
| 2012 | $2.27 billion |
| 2013 | $3.05 billion |
| 2014 | $4.07 billion |
| 2015 | $5.37 billion |
| 2016 | $6.67 billion |
| 2017 | $8.44 billion |
| 2018 | $10.54 billion |
| 2019 | $13.28 billion |
| 2020 | $17.1 billion |
| 2021 | $21.25 billion |
| 2022 | $26.49 billion |
| 2023 | $31.35 billion |
| 2024 | $34.86 billion |
| 2025 | $37.9 billion |
Source: Salesforce
Salesforce Revenue by Segment
Salesforce breaks down its revenue into two segments. The first is subscription and support revenues. The second is professional services and other revenues.
Subscription and support revenues are by far the largest income stream for Salesforce. The segment includes cloud services, software licenses, and related technical support.
The subscription and support segment accounts for 94.2% of Salesforce’s total revenue, which comes to $35.7 billion in 2025. That’s an increase of 10% over the 2024 financial year.
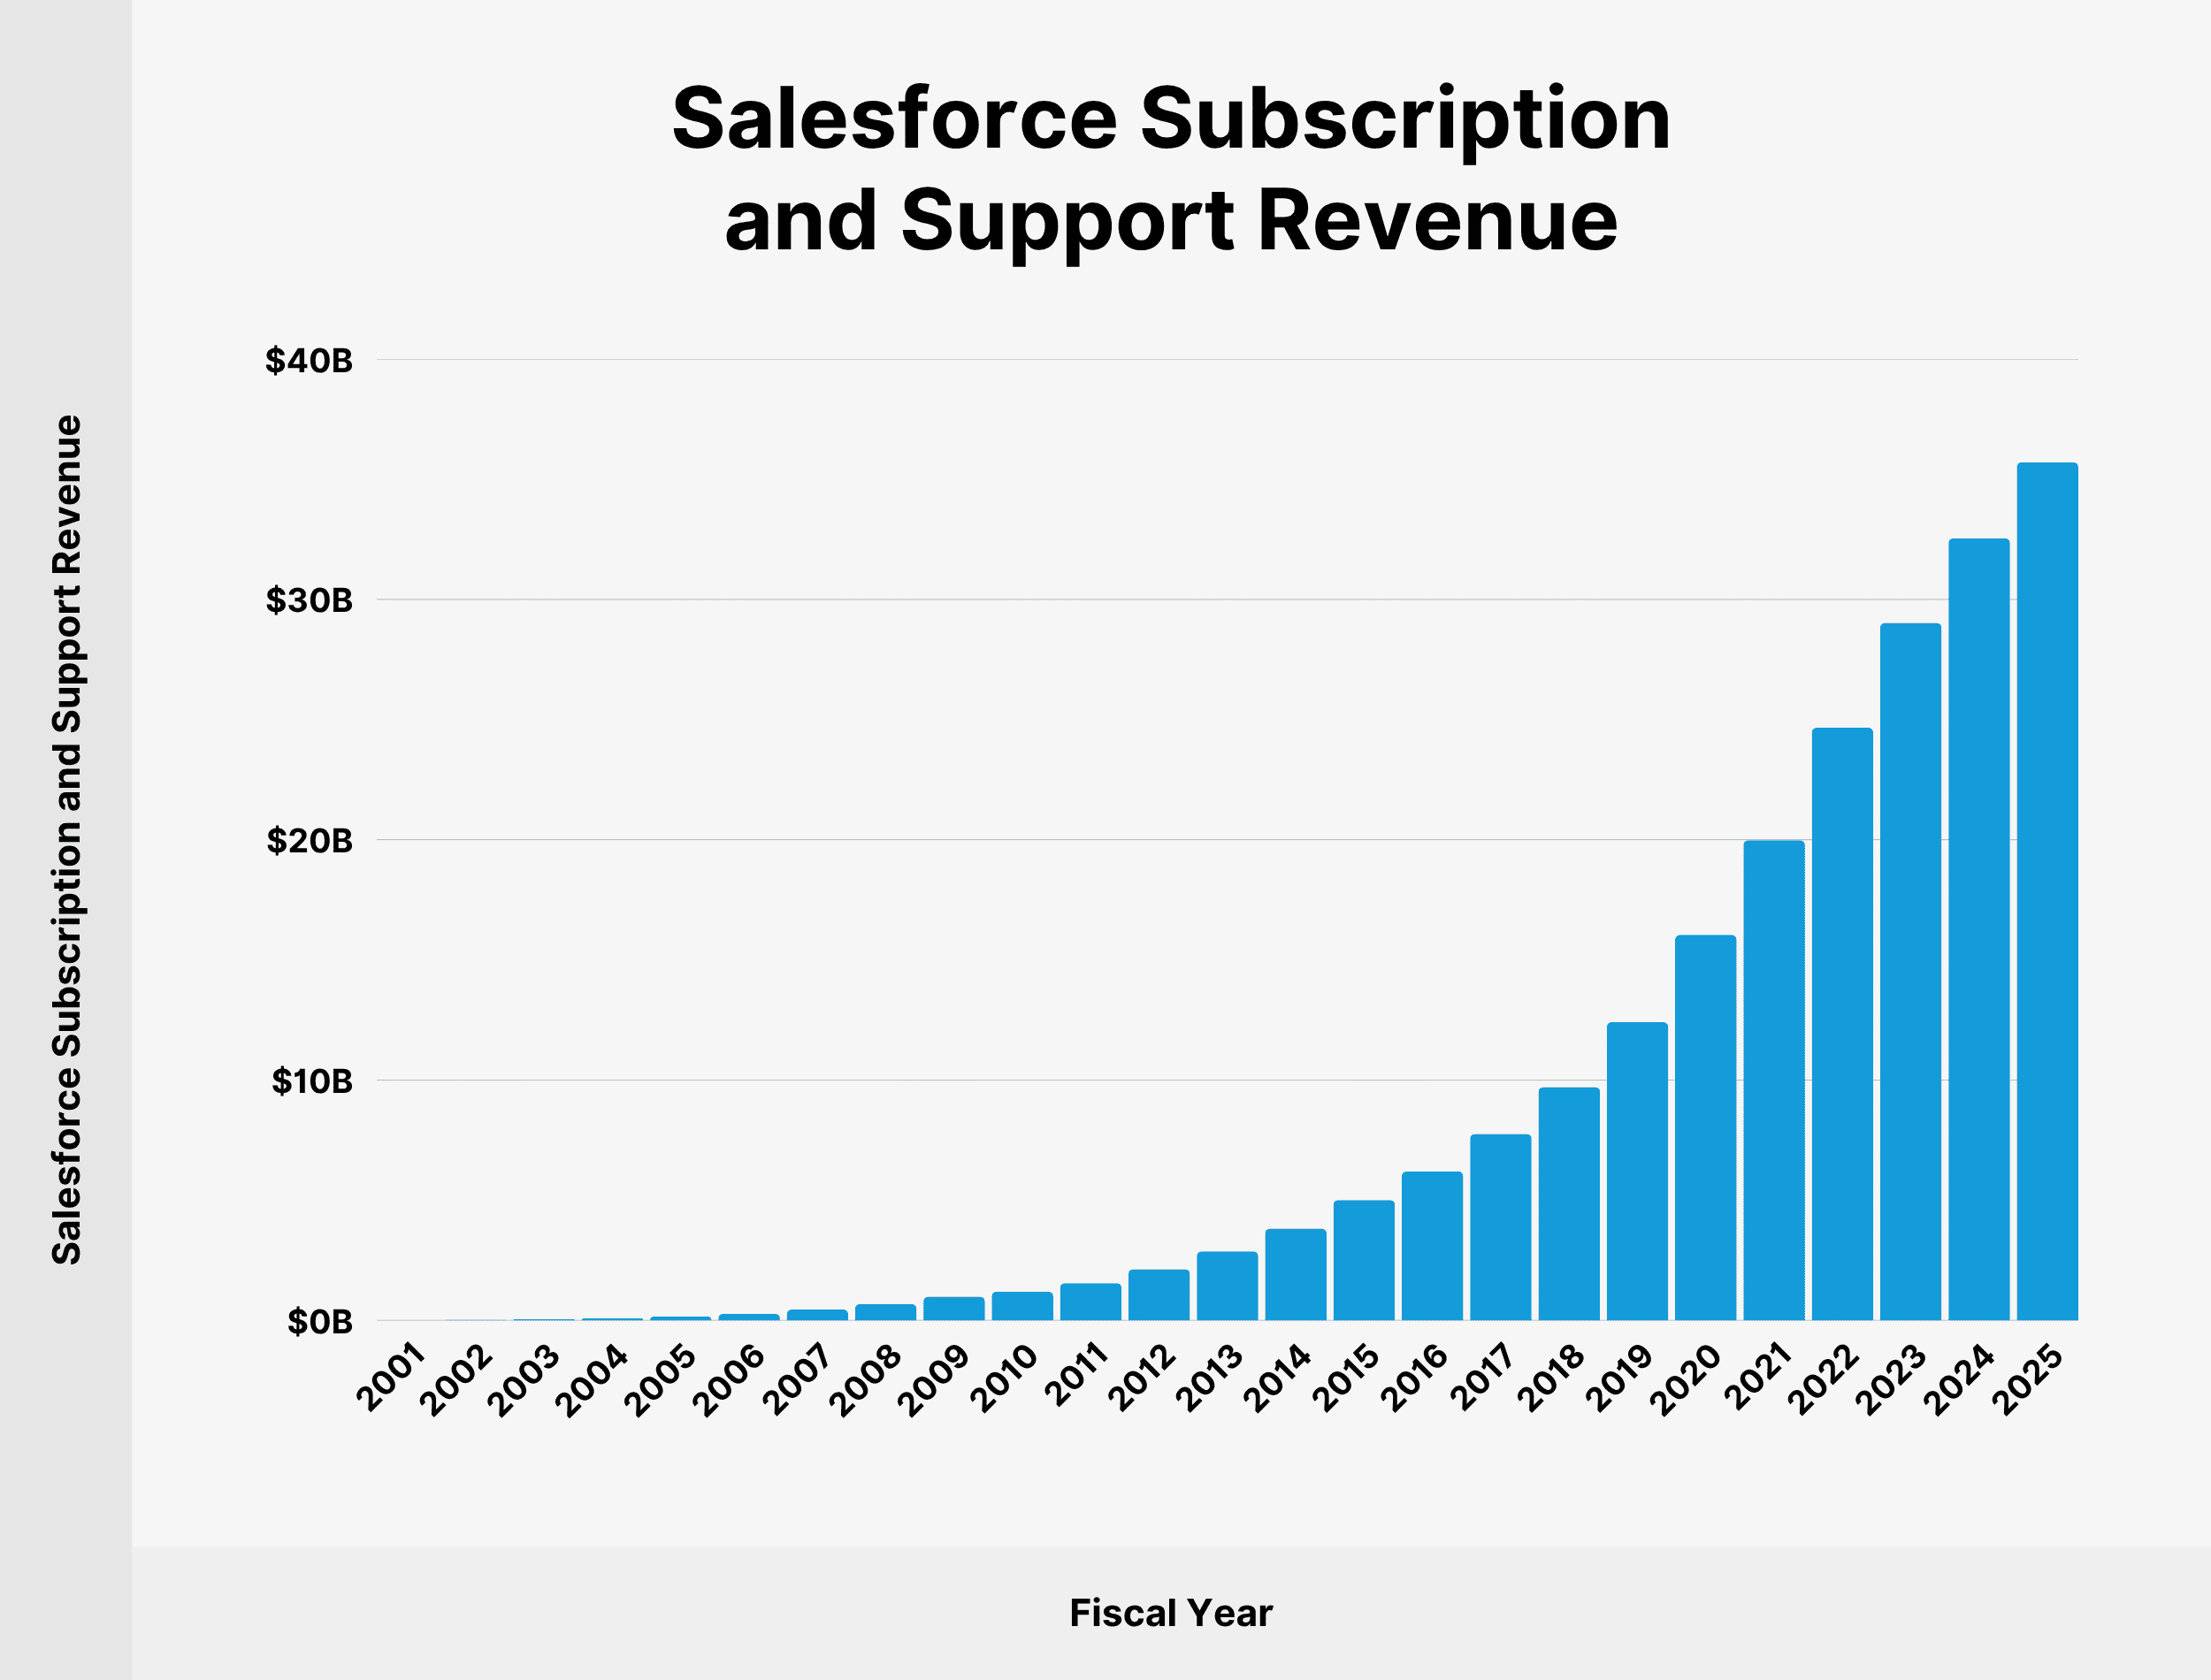
Revenues from subscriptions and support have recorded growth each year since the company’s foundation. Over the last 5 years, revenue from subscription and support has more than doubled.
Here’s a table showing Salesforce revenue from the subscription and support sector since 2001:
| Fiscal Year | Salesforce Subscription and Support Revenue |
|---|---|
| 2001 | $5.02 million |
| 2002 | $21.51 million |
| 2003 | $47.66 million |
| 2004 | $85.8 million |
| 2005 | $157.98 million |
| 2006 | $280.64 million |
| 2007 | $451.66 million |
| 2008 | $680.58 million |
| 2009 | $984.57 million |
| 2010 | $1.2 billion |
| 2011 | $1.55 billion |
| 2012 | $2.13 billion |
| 2013 | $2.87 billion |
| 2014 | $3.82 billion |
| 2015 | $5.01 billion |
| 2016 | $6.2 billion |
| 2017 | $7.76 billion |
| 2018 | $9.71 billion |
| 2019 | $12.41 billion |
| 2020 | $16.04 billion |
| 2021 | $19.98 billion |
| 2022 | $24.66 billion |
| 2023 | $29.02 billion |
| 2024 | $32.54 billion |
| 2025 | $35.7 billion |
The professional services and other revenues segment encompasses fees paid on a fixed-price or time basis.
5.86% of total Salesforce revenue came from this segment in 2025, accounting for $2.22 billion in segment revenue.
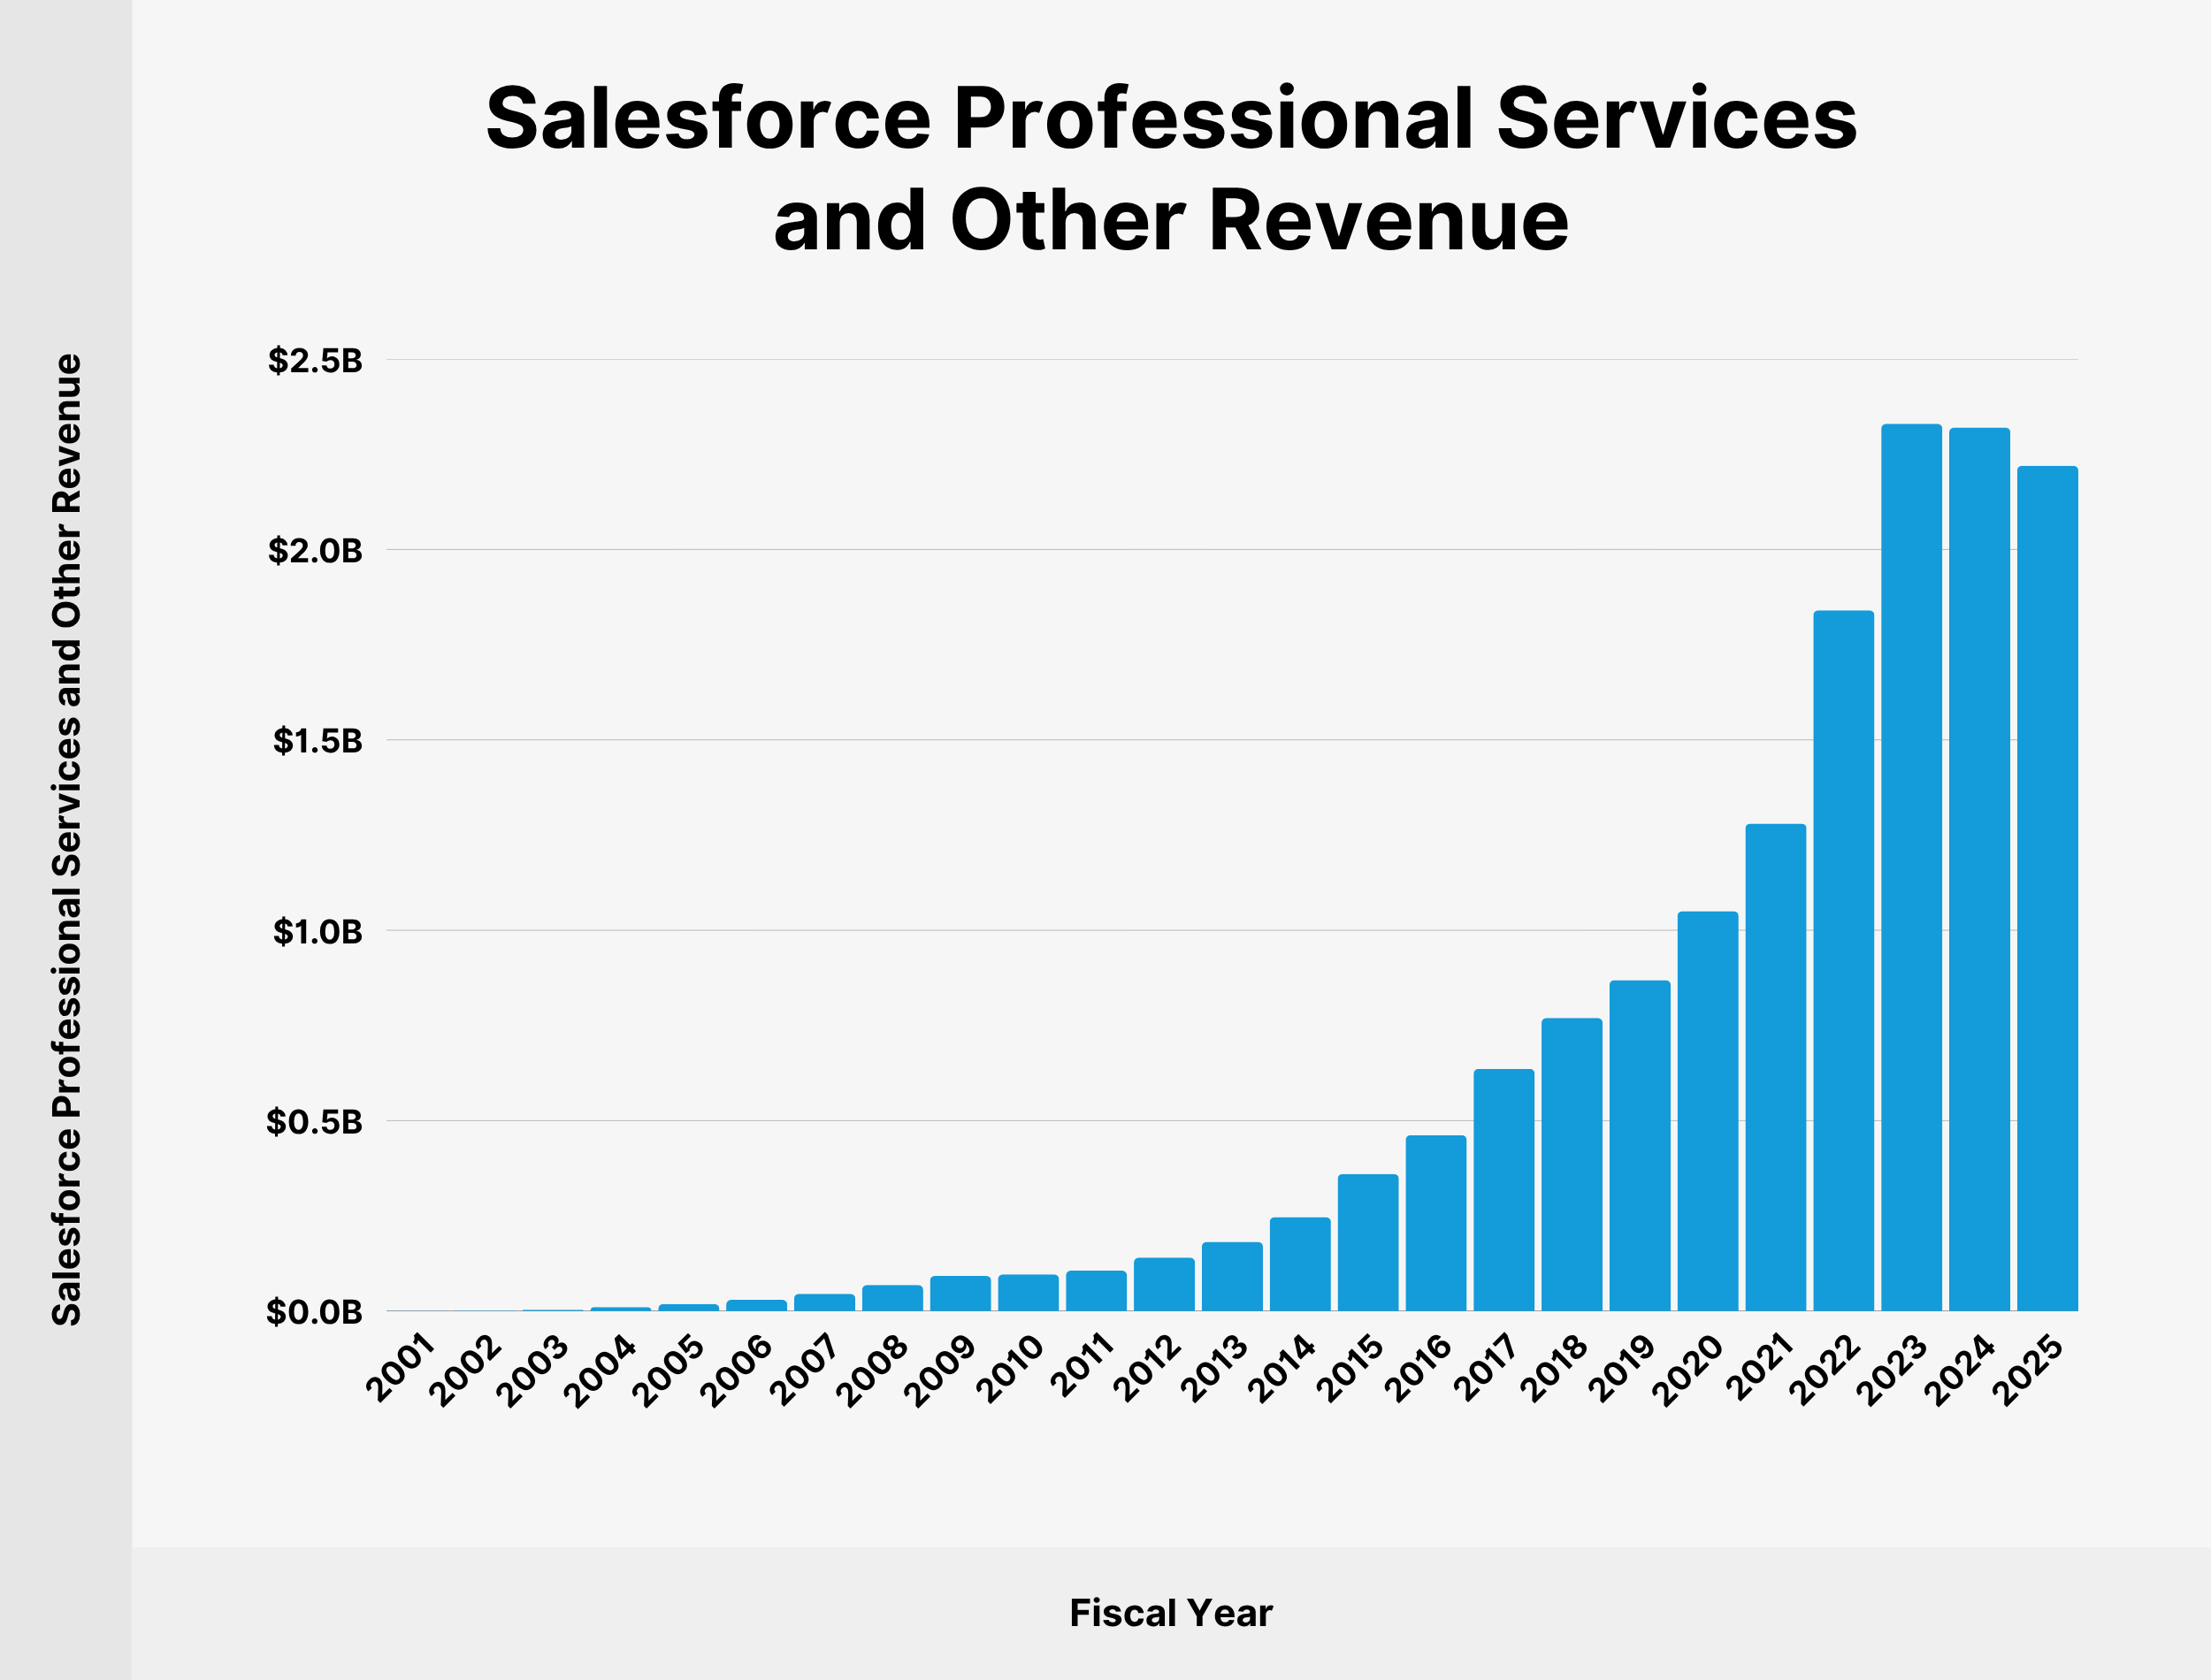
Here’s a table with Salesforce professional services and other revenues since 2001:
| Fiscal Year | Salesforce Professional Services and Other Revenue |
|---|---|
| 2001 | $413,000 |
| 2002 | $896,000 |
| 2003 | $3.33 million |
| 2004 | $10.23 million |
| 2005 | $18.4 million |
| 2006 | $29.22 million |
| 2007 | $45.44 million |
| 2008 | $68.12 million |
| 2009 | $92.2 million |
| 2010 | $96.11 million |
| 2011 | $105.99 million |
| 2012 | $140.31 million |
| 2013 | $181.39 million |
| 2014 | $246.46 million |
| 2015 | $359.82 million |
| 2016 | $461.62 million |
| 2017 | $635.78 million |
| 2018 | $769.47 million |
| 2019 | $869 million |
| 2020 | $1.05 billion |
| 2021 | $1.28 billion |
| 2022 | $1.84 billion |
| 2023 | $2.33 billion |
| 2024 | $2.32 billion |
| 2025 | $2.22 billion |
Source: Salesforce
Salesforce Revenue by Product/Service Type
Within its broader subscription and support segment, Salesforce provides a revenue breakdown of 5 service offerings:
- Sales
- Service
- Platform and Other
- Marketing and Commerce
- Integration and Analytics
Sales Cloud is an application that helps companies manage and automate sales processes.
Salesforce brought in $8.32 billion in fees related to Sales Cloud in 2025. That’s 23.32% of total subscription and support revenues.
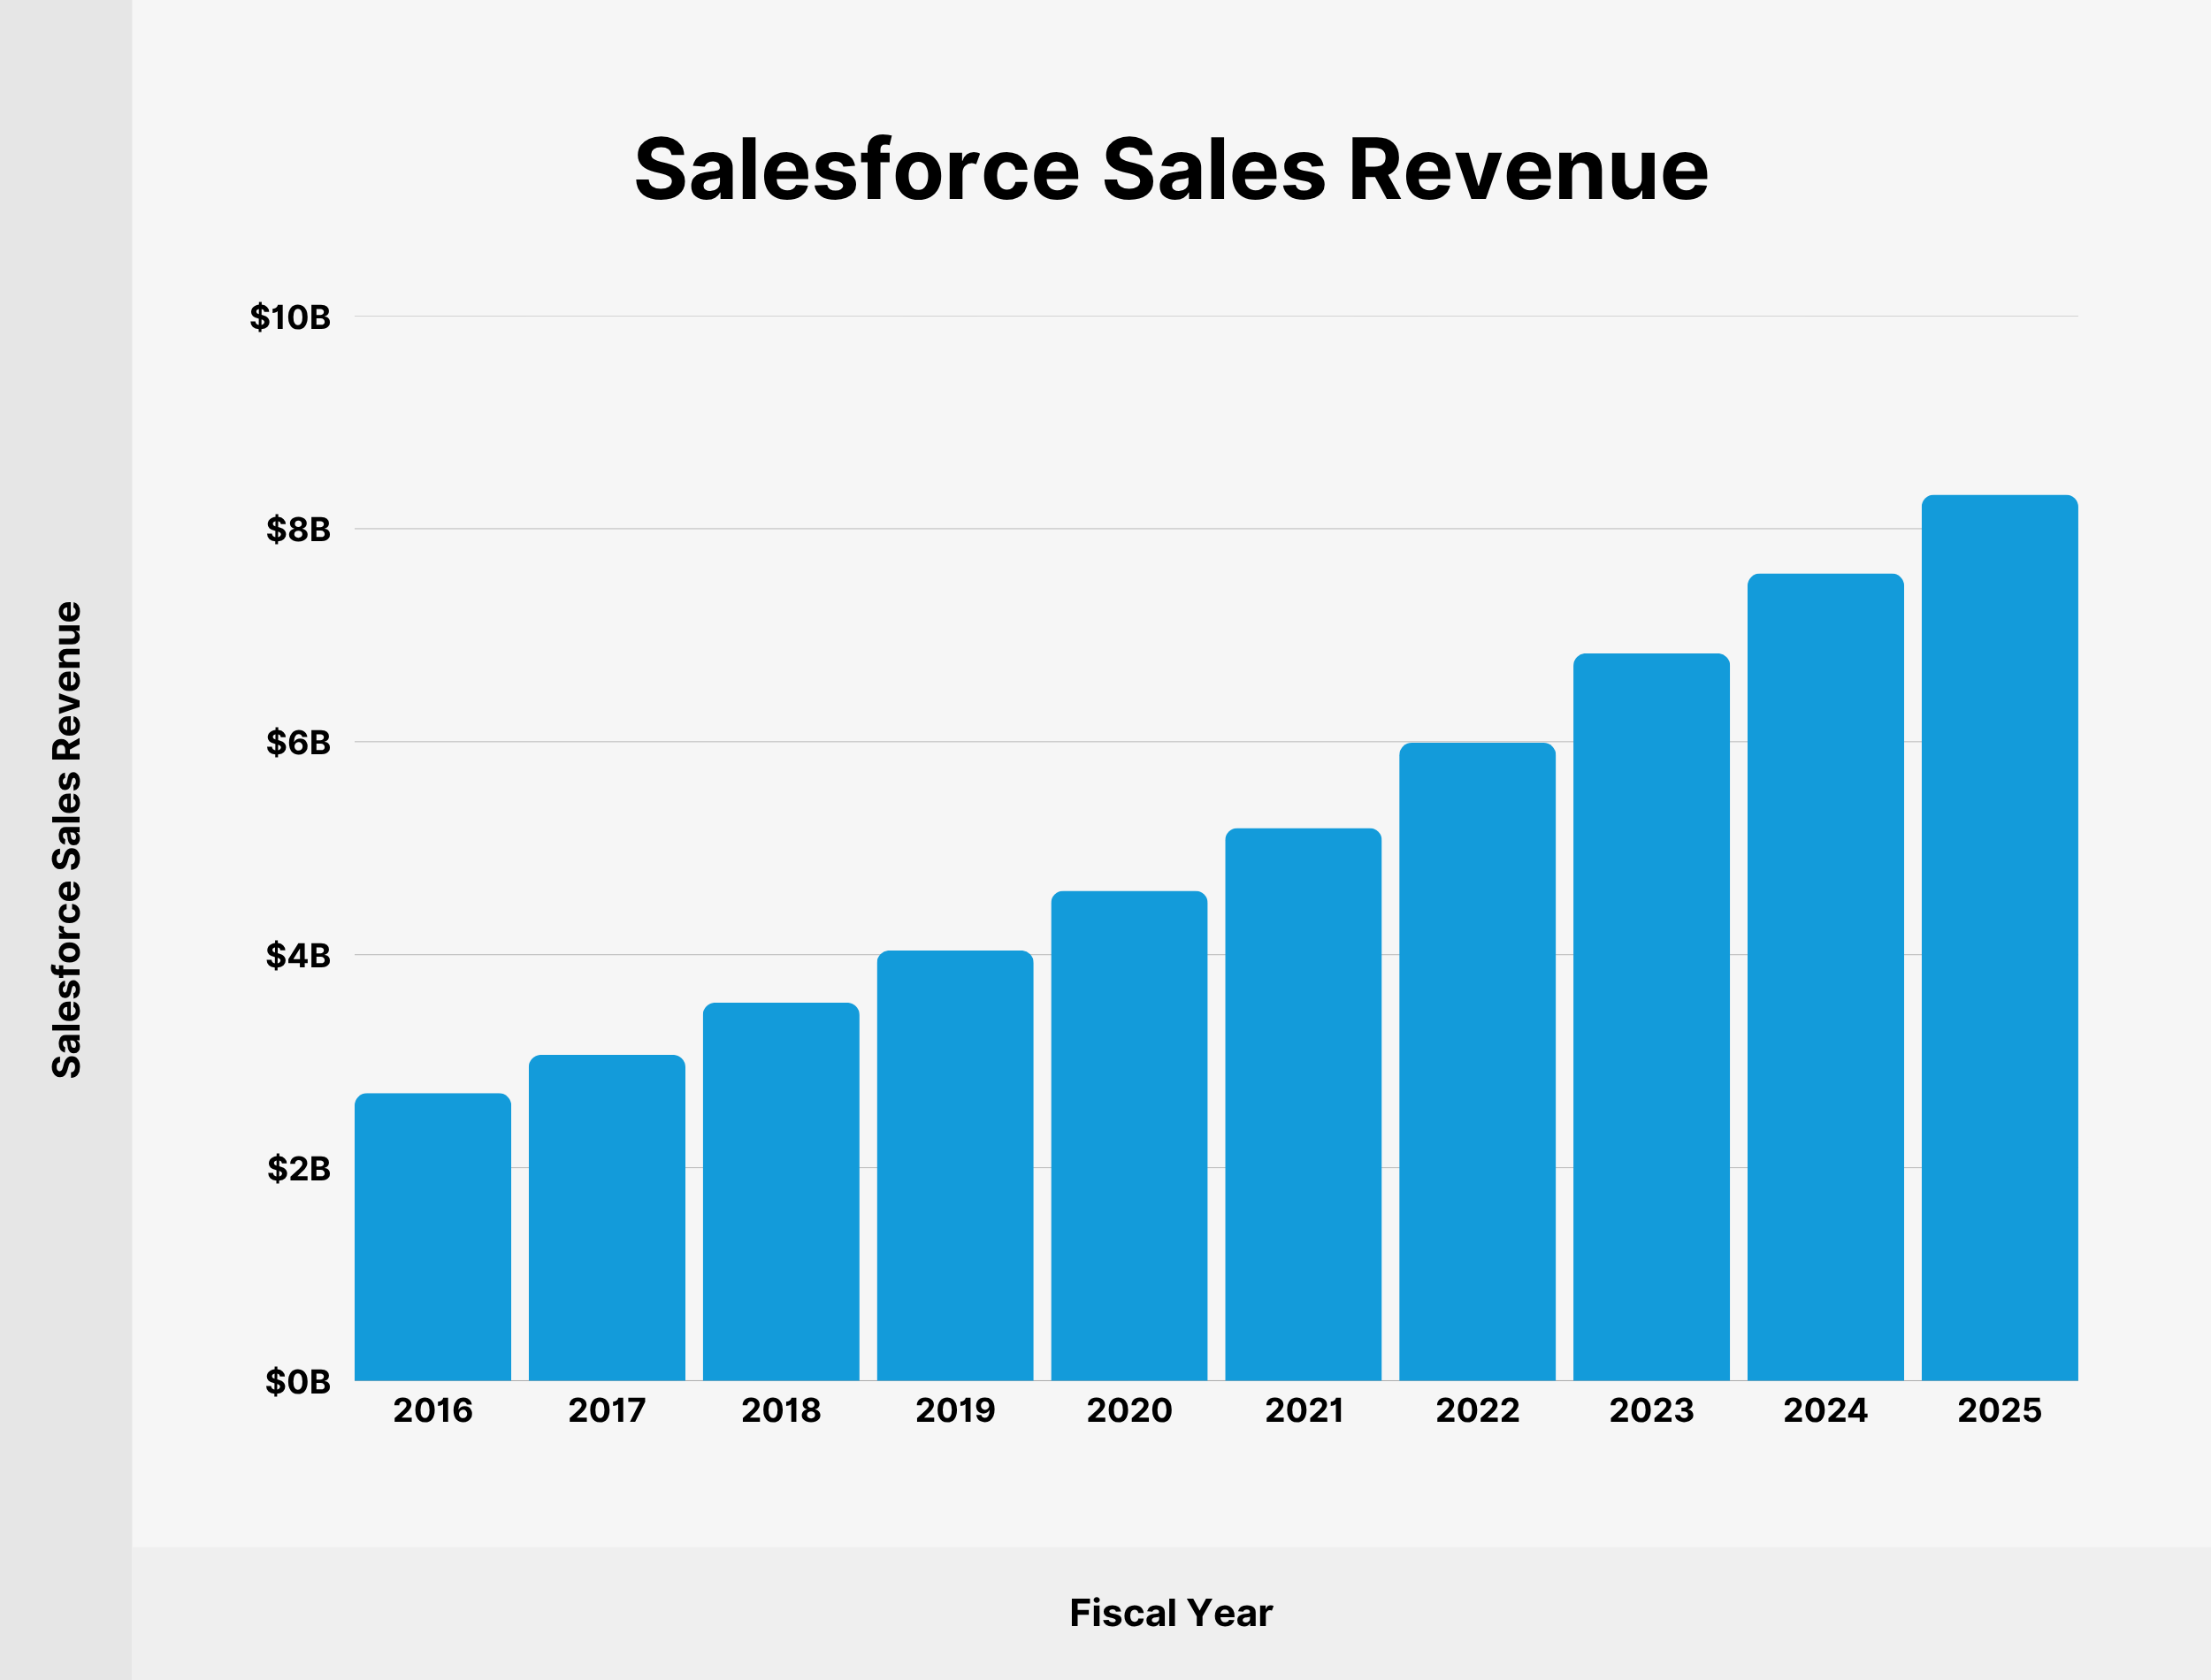
Here’s a table showing Salesforce Sales Cloud revenue since 2016:
| Fiscal Year | Salesforce Sales Revenue |
|---|---|
| 2016 | $2.7 billion |
| 2017 | $3.06 billion |
| 2018 | $3.55 billion |
| 2019 | $4.04 billion |
| 2020 | $4.6 billion |
| 2021 | $5.19 billion |
| 2022 | $5.99 billion |
| 2023 | $6.83 billion |
| 2024 | $7.58 billion |
| 2025 | $8.32 billion |
Service Cloud is a service management platform that helps companies deliver personalized customer service.
Salesforce generated $9.05 billion from revenue related to Service Cloud in the 2025 fiscal year. That’s an increase of 9.81% over 2024.
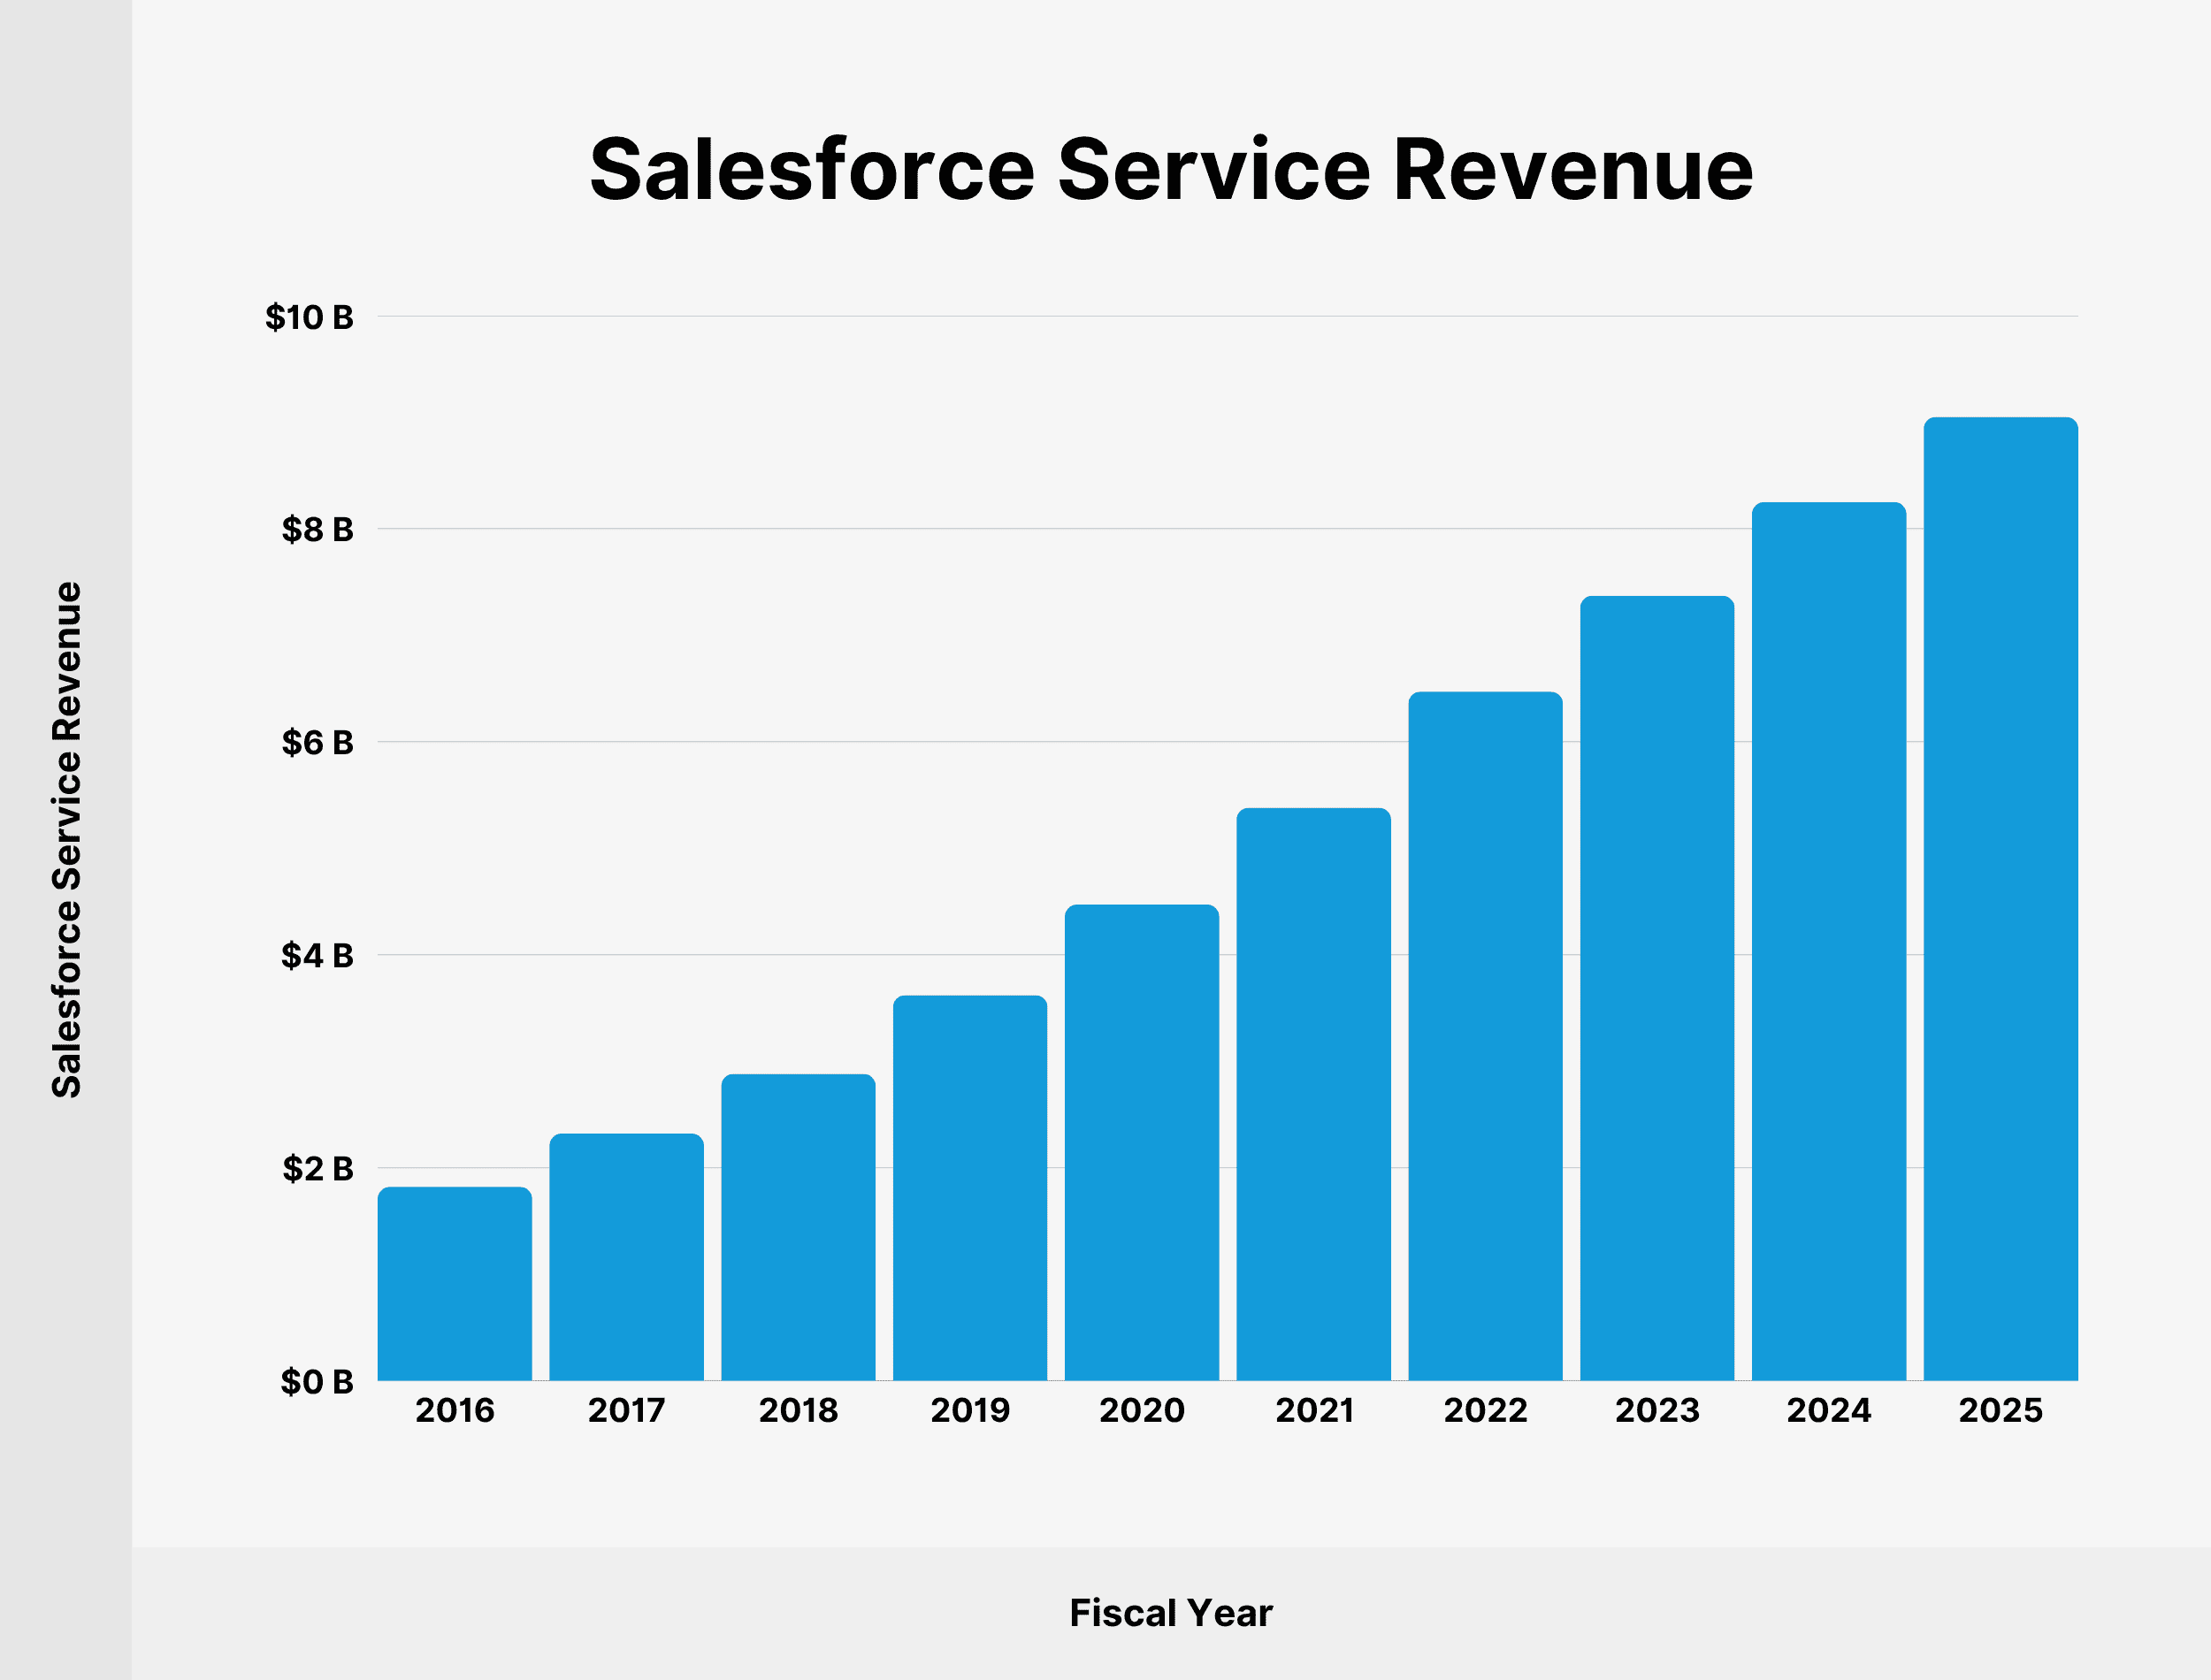
We’ve charted Salesforce Service Cloud revenue since 2016:
| Fiscal Year | Salesforce Service Revenue |
|---|---|
| 2016 | $1.82 billion |
| 2017 | $2.32 billion |
| 2018 | $2.88 billion |
| 2019 | $3.62 billion |
| 2020 | $4.47 billion |
| 2021 | $5.38 billion |
| 2022 | $6.47 billion |
| 2023 | $7.37 billion |
| 2024 | $8.25 billion |
| 2025 | $9.05 billion |
Salesforce’s third offering bundles together the Platform service with miscellaneous other products.
Salesforce generated $7.25 billion in platform and other revenue in 2025, accounting for 20.31% of the subscription and support segment revenue.
Here’s a table showing annual Salesforce platform and other revenue since 2022:
| Fiscal Year | Salesforce Platform and Other Revenue |
|---|---|
| 2022 | $4.51 billion |
| 2023 | $5.97billion |
| 2024 | $6.61 billion |
| 2025 | $7.25 billion |
Salesforce brought in $5.28 billion in revenue from marketing and commerce offerings in 2025. That’s an increase of 7.51% over the previous year.
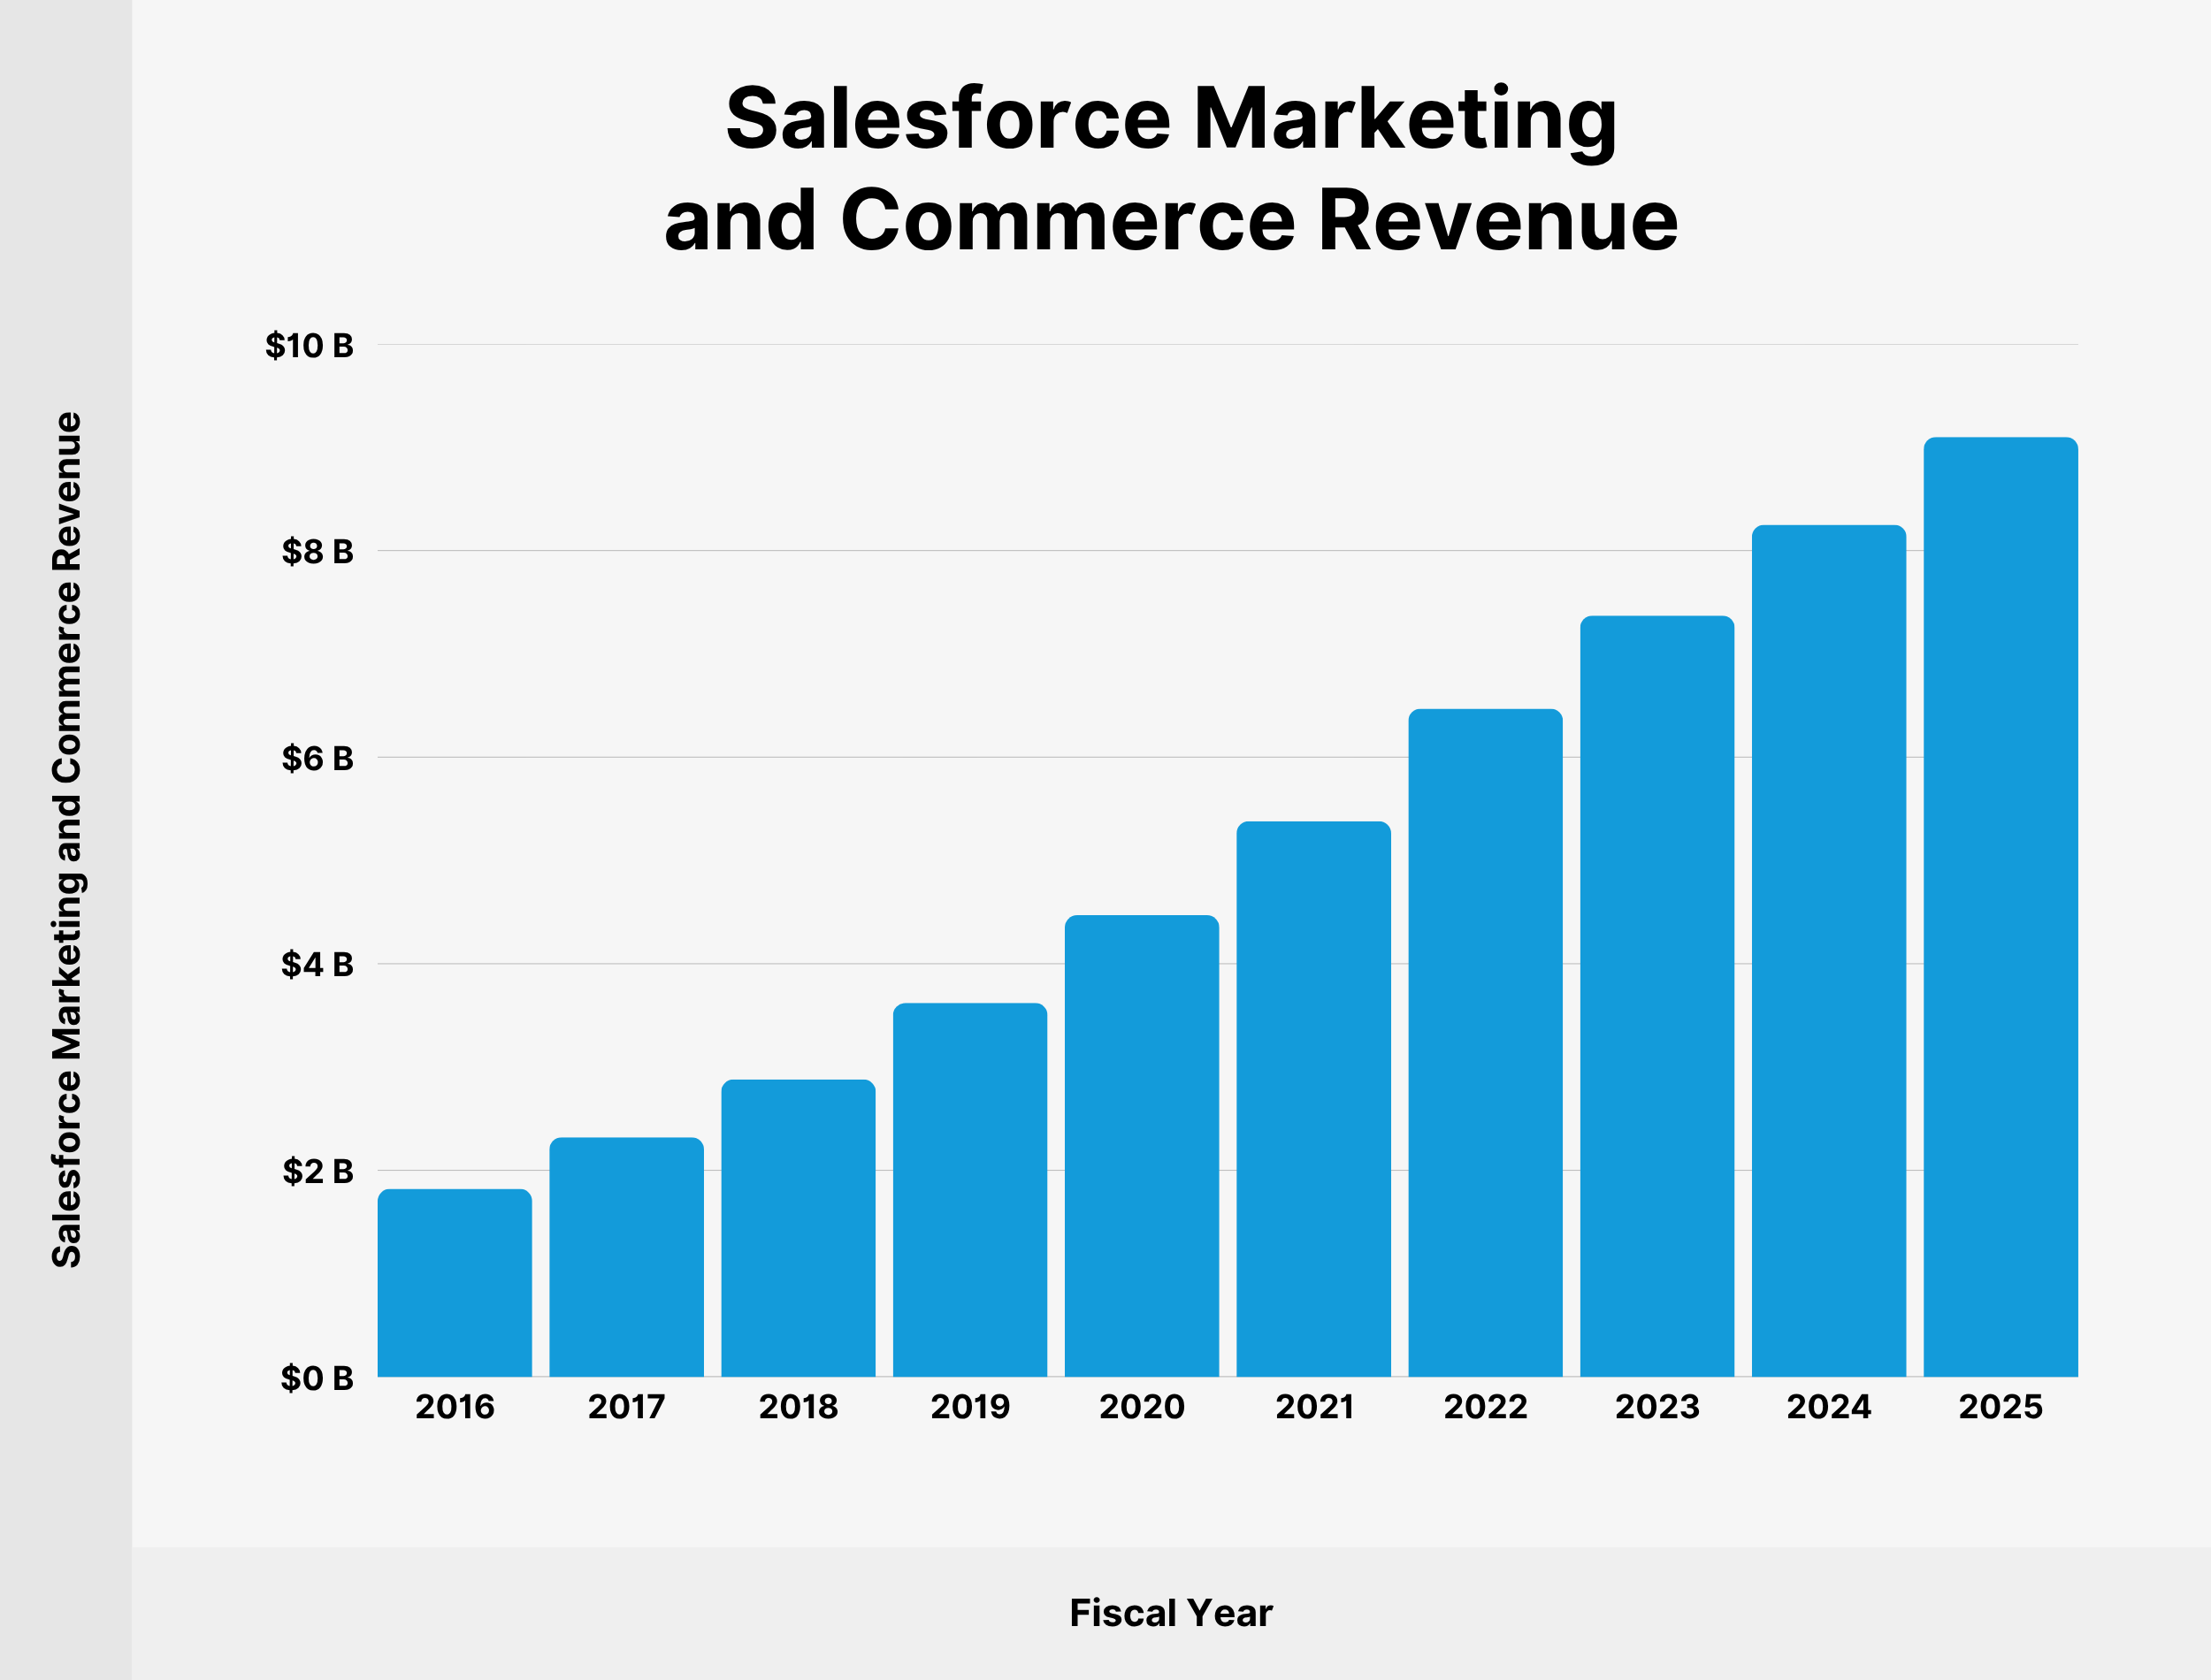
Marketing and Commerce accounts for 15% of all subscription and support revenue.
Here’s a table with Salesforce Service revenue since 2016:
| Fiscal Year | Salesforce Marketing and Commerce Revenue |
|---|---|
| 2016 | $1.82 billion |
| 2017 | $2.32 billion |
| 2018 | $2.88 billion |
| 2019 | $3.62 billion |
| 2020 | $4.47 billion |
| 2021 | $5.38 billion |
| 2022 | $6.47 billion |
| 2023 | $7.37 billion |
| 2024 | $8.25 billion |
| 2025 | $9.1 billion |
Finally, Salesforce groups together Integration and Analytics offerings, including Mulesoft and Tableau.
In 2025, Salesforce generated $5.78 billion in Integration and Analytics revenue.
Here’s a table showing annual Salesforce integration and analytics revenue, including Mulesoft and Tableau since 2022:
| Fiscal Year | Salesforce Integration and Analytics Revenue |
|---|---|
| 2022 | $3.78 billion |
| 2023 | $4.34 billion |
| 2024 | $5.19 billion |
| 2025 | $5.78 billion |
Source: Salesforce
Salesforce Revenue by Region
Salesforce provides a breakdown of revenues by region.
Regional data is based on the registered addresses of customers. So it may not be fully representative of where the businesses operate. But it provides a good indication.
The Americas region contributed $25.14 billion (66%) of total annual Salesforce revenue in 2025. Revenue from American customers has increased by 7.96% since 2024.
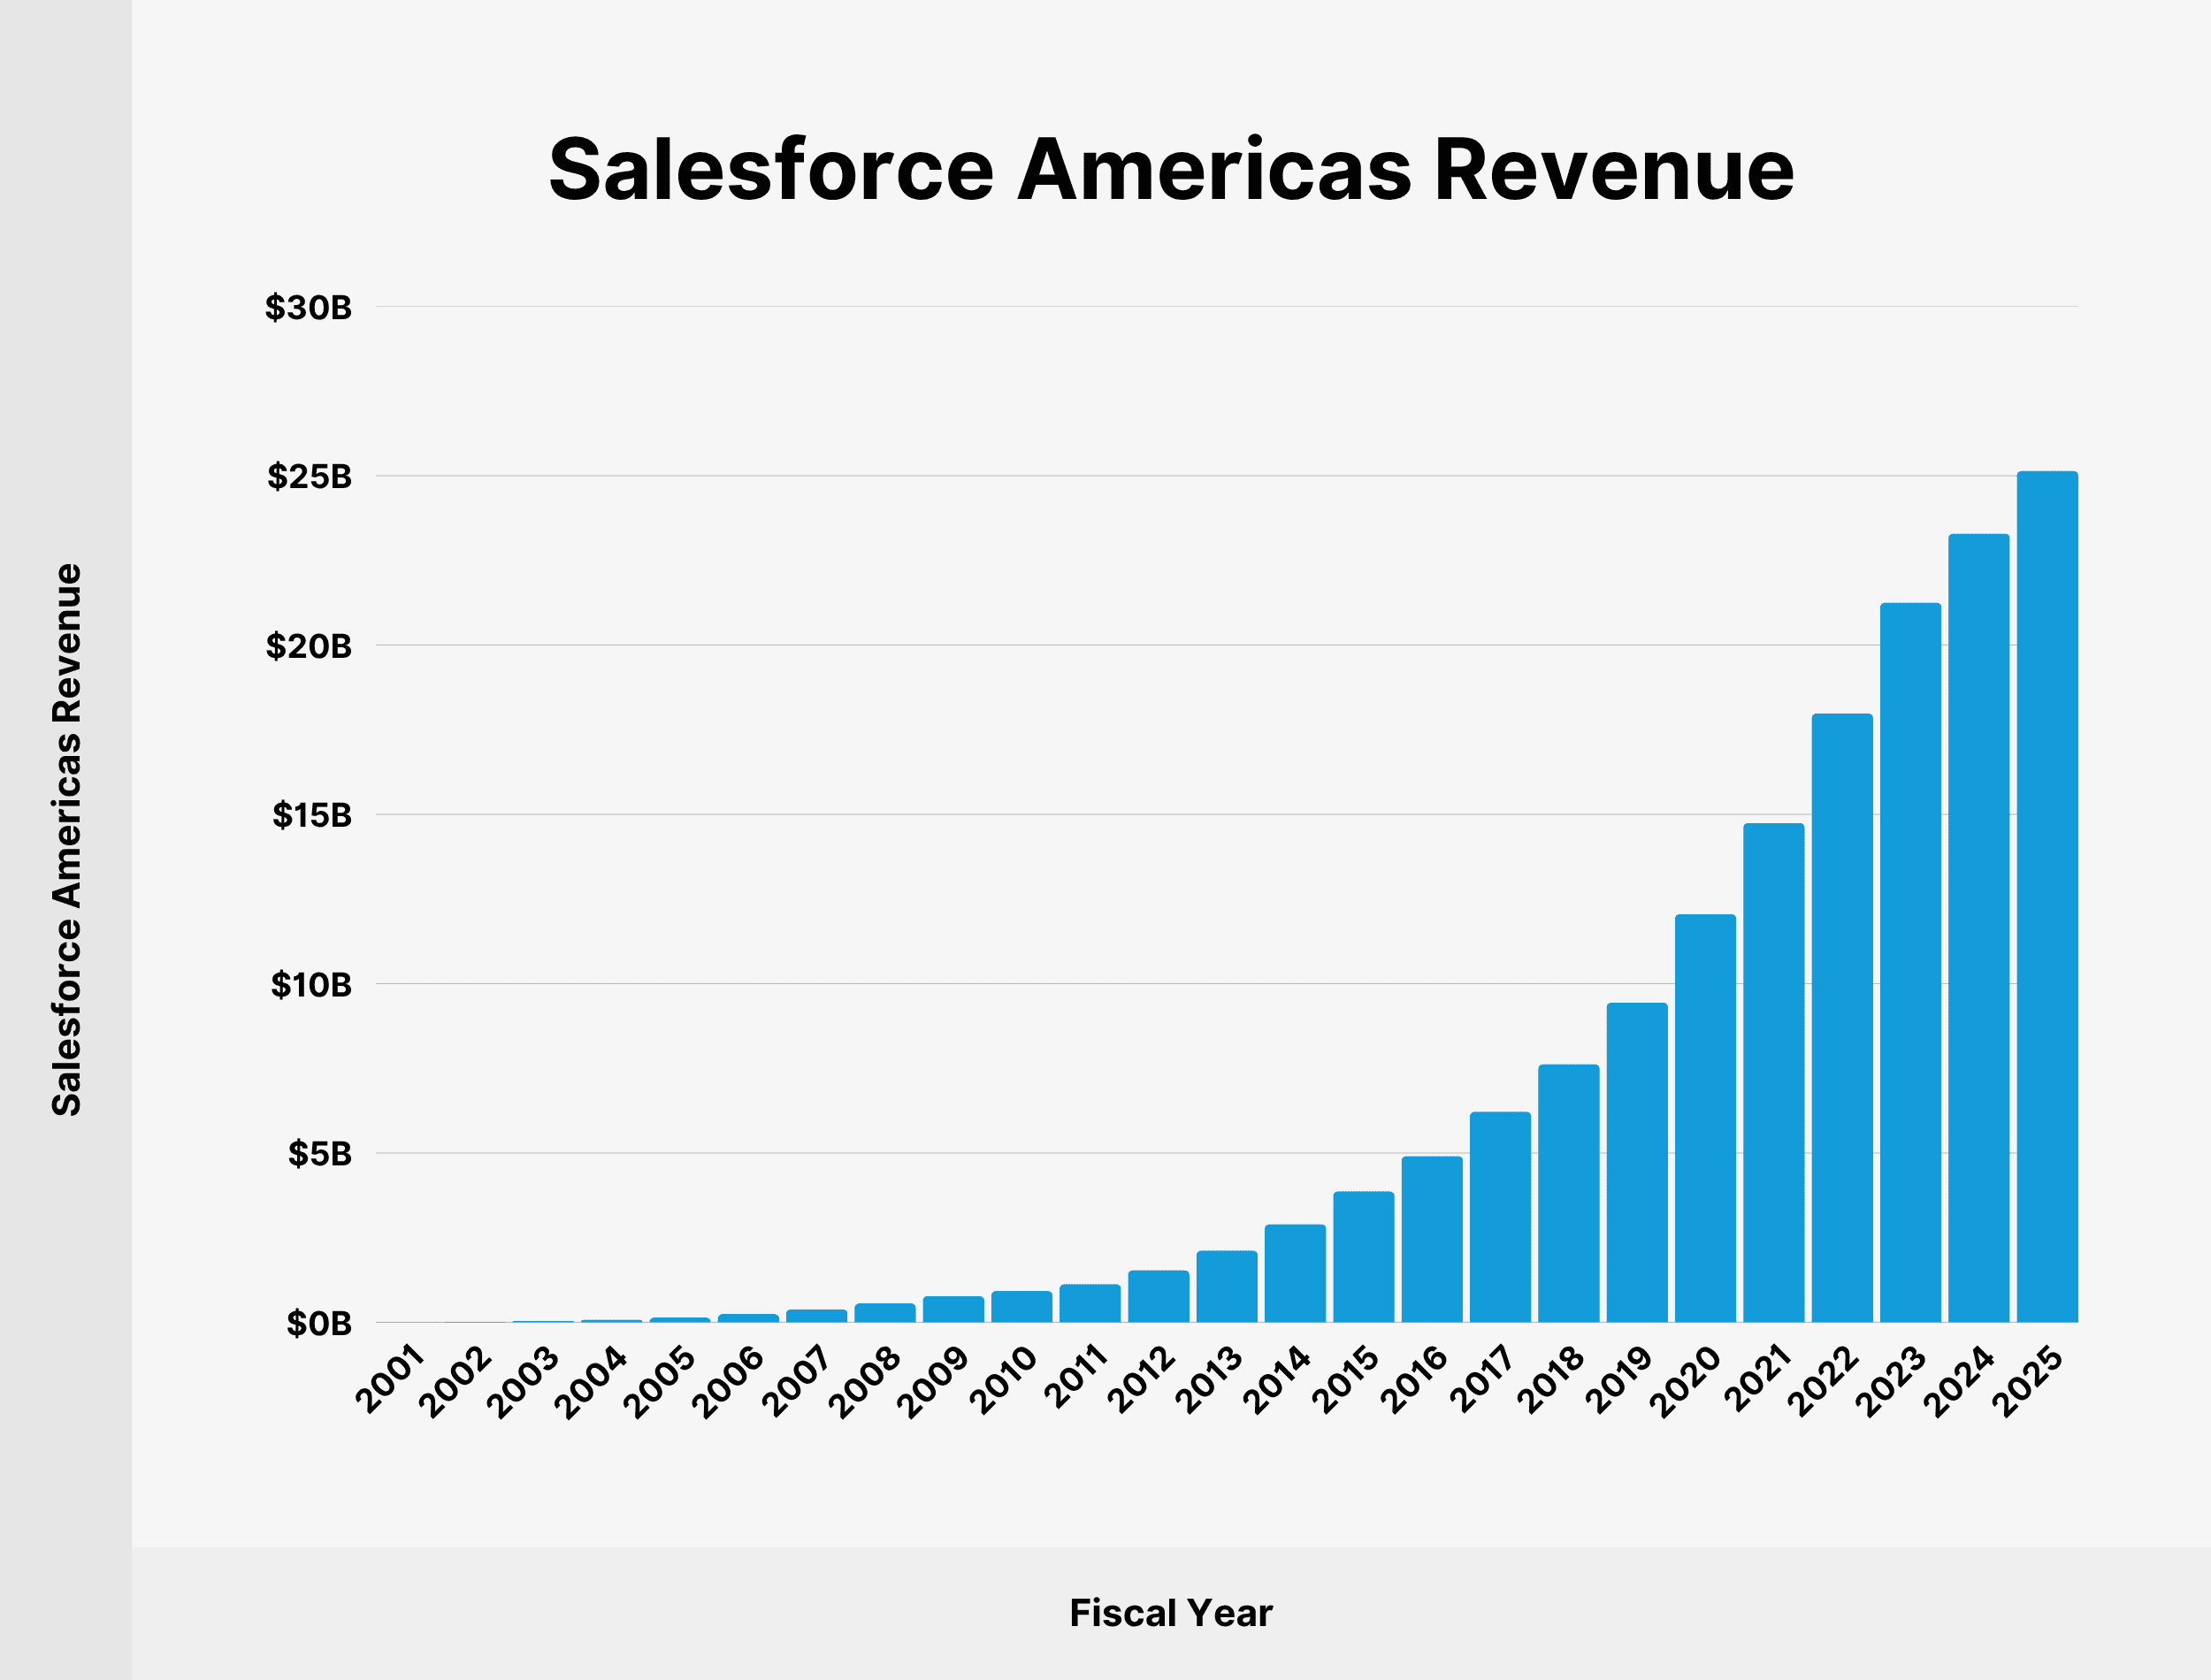
Here’s a table showing revenue from Salesforce customers registered in the Americas since 2001:
| Fiscal Year | Salesforce Americas Revenue |
|---|---|
| 2001 | $5.31 million |
| 2002 | $20.3 million |
| 2003 | $43.85 million |
| 2004 | $78.96 million |
| 2005 | $140.87 million |
| 2006 | $247 million |
| 2007 | $387.57 million |
| 2008 | $557.98 million |
| 2009 | $776.5 million |
| 2010 | $923.82 million |
| 2011 | $1.13 billion |
| 2012 | $1.54 billion |
| 2013 | $2.12 billion |
| 2014 | $2.9 billion |
| 2015 | $3.87 billion |
| 2016 | $4.91 billion |
| 2017 | $6.22 billion |
| 2018 | $7.62 billion |
| 2019 | $9.44 billion |
| 2020 | $12.05 billion |
| 2021 | $14.74 billion |
| 2022 | $17.98 billion |
| 2023 | $21.25 billion |
| 2024 | $23.29 billion |
| 2025 | $25.14 billion |
Europe contributes the second-largest portion of Salesforce’s revenue. European spending on Salesforce products totaled $8.89 billion in 2025, 24% of annual revenue.
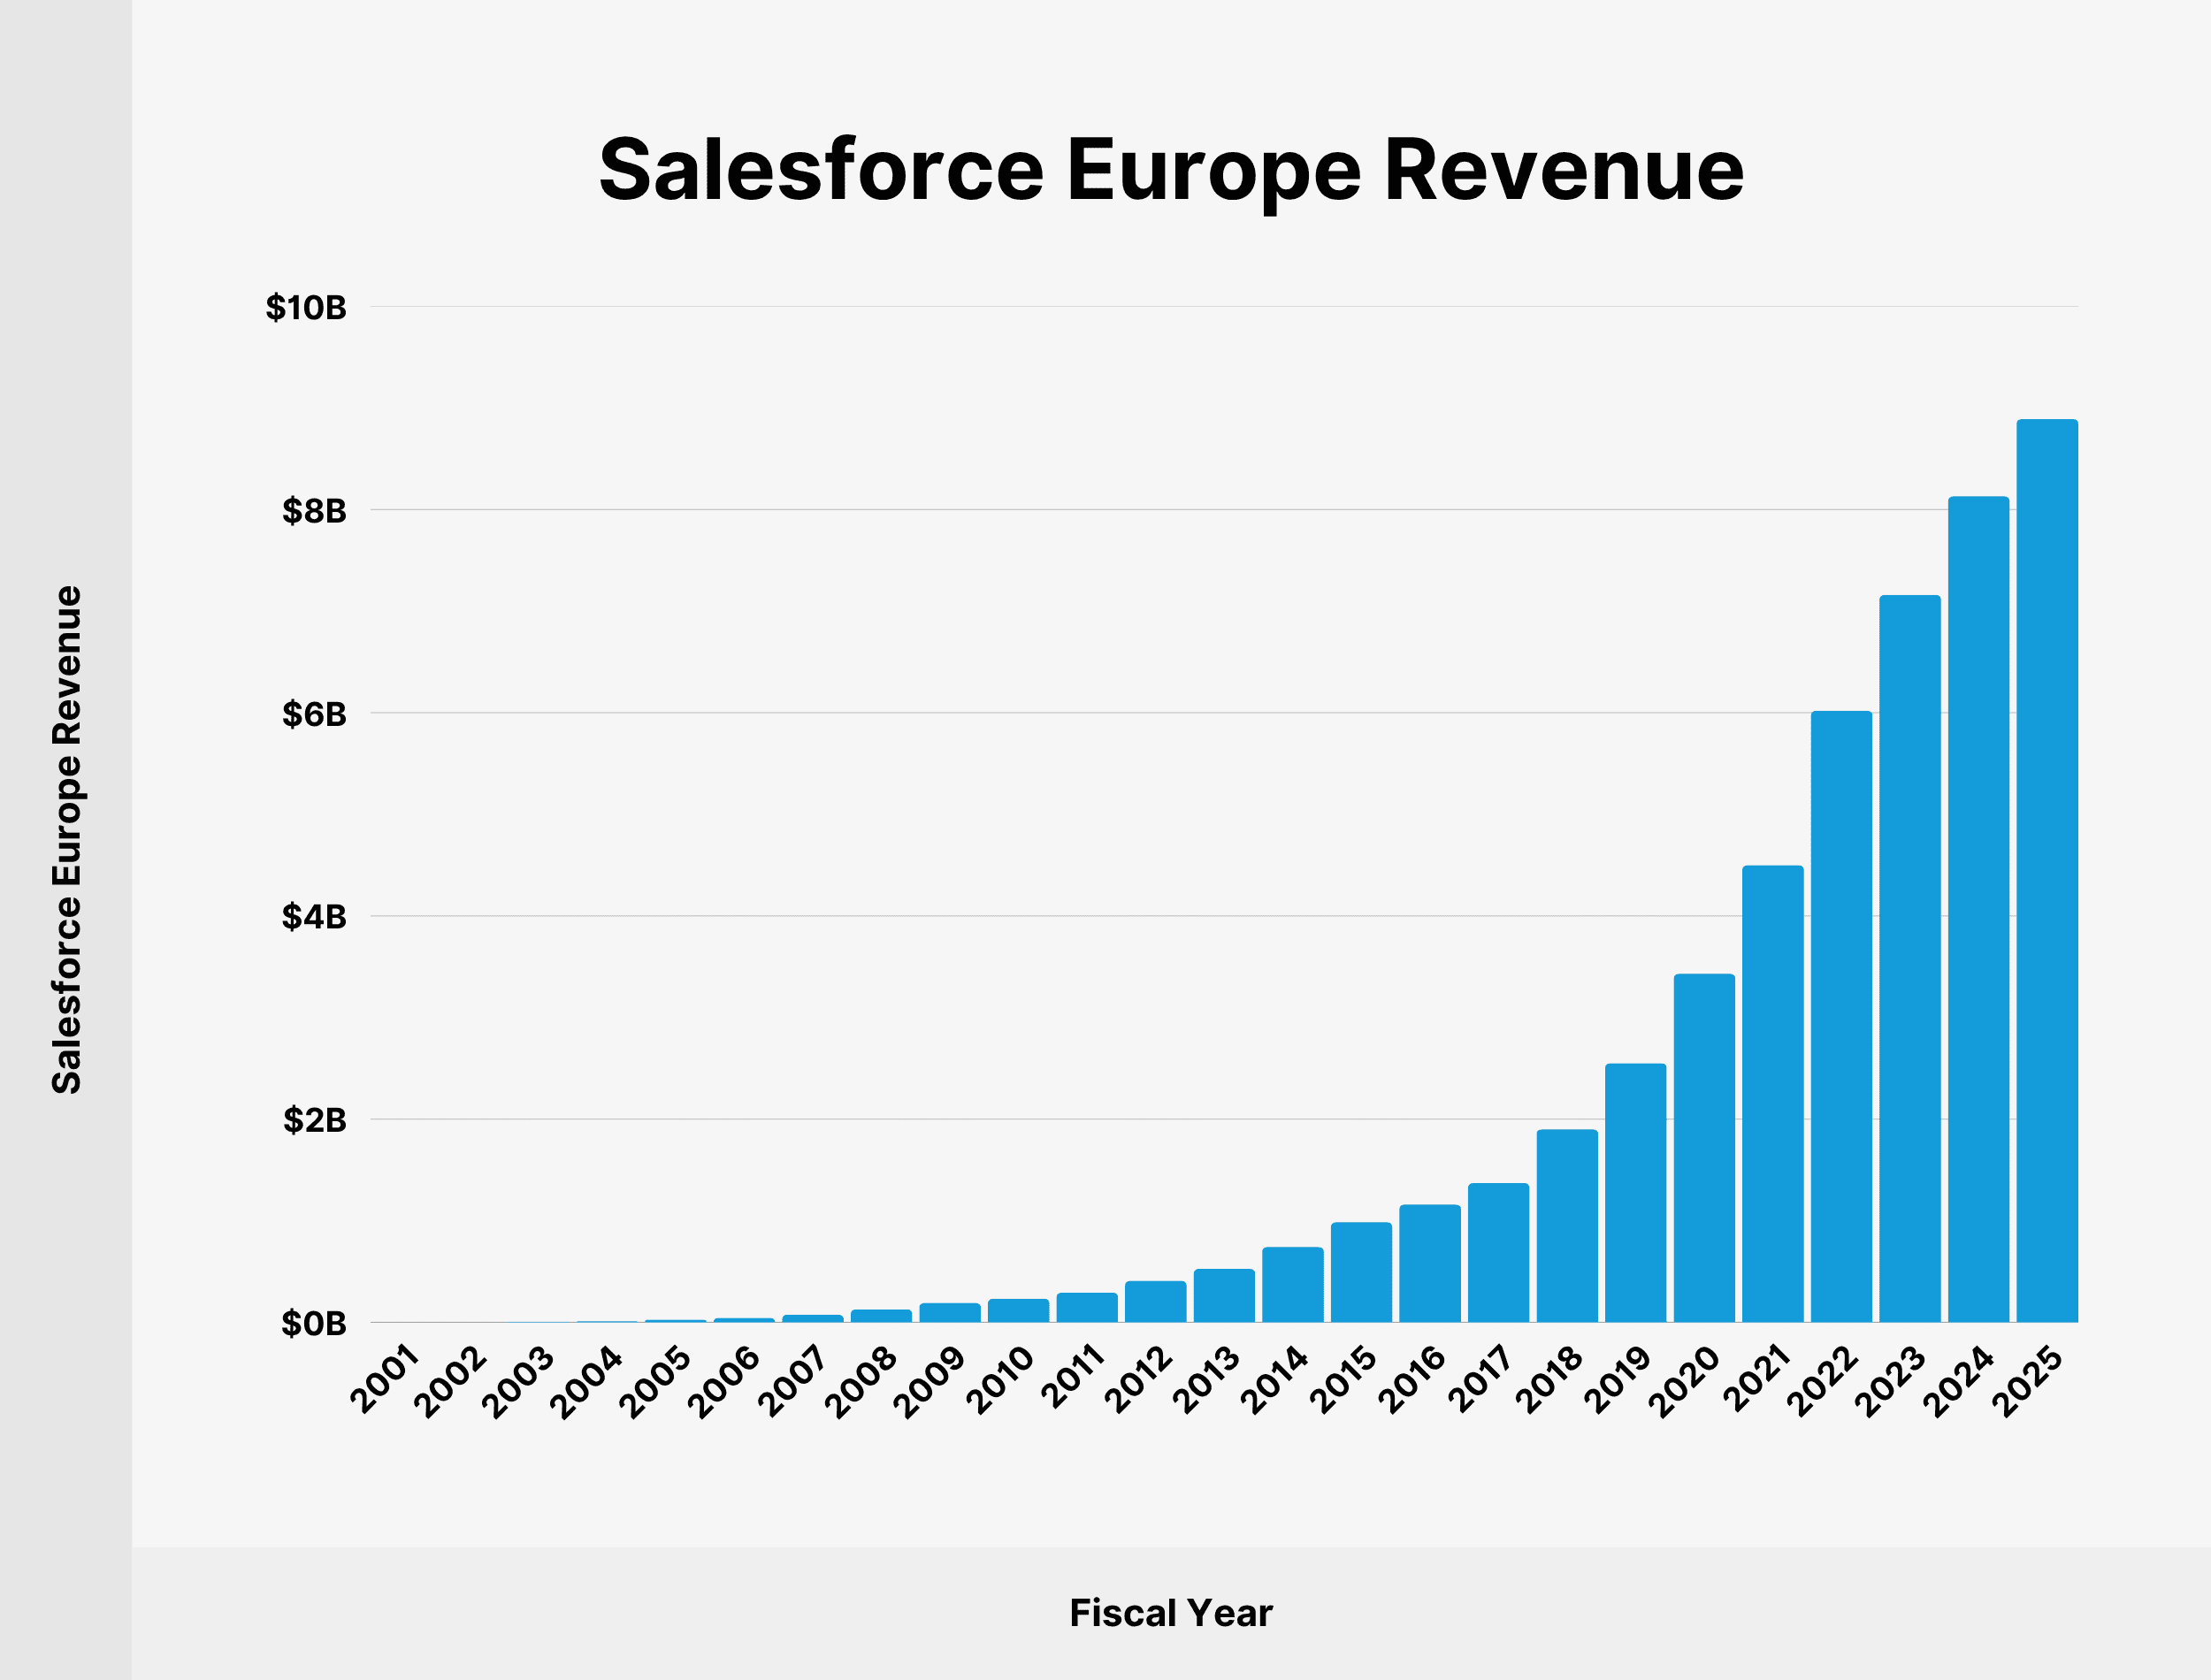
We’ve charted Salesforce revenue from the European market since 2001:
| Fiscal Year | Salesforce Europe Revenue |
|---|---|
| 2001 | $123,000 |
| 2002 | $1.68 million |
| 2003 | $5.34 million |
| 2004 | $11.75 million |
| 2005 | $25.2 million |
| 2006 | $43.58 million |
| 2007 | $75.03 million |
| 2008 | $127.01 million |
| 2009 | $190.68 million |
| 2010 | $232.37 million |
| 2011 | $291.78 million |
| 2012 | $408.46 million |
| 2013 | $525.3 million |
| 2014 | $741.22 million |
| 2015 | $984.92 million |
| 2016 | $1.16 billion |
| 2017 | $1.37 billion |
| 2018 | $1.9 billion |
| 2019 | $2.55 billion |
| 2020 | $3.43 billion |
| 2021 | $4.5 billion |
| 2022 | $6.02 billion |
| 2023 | $7.16 billion |
| 2024 | $8.13 billion |
| 2025 | $8.89 billion |
The Asia Pacific market accounts for $3.86 billion of annual Salesforce revenue, which is 10% of total revenue.
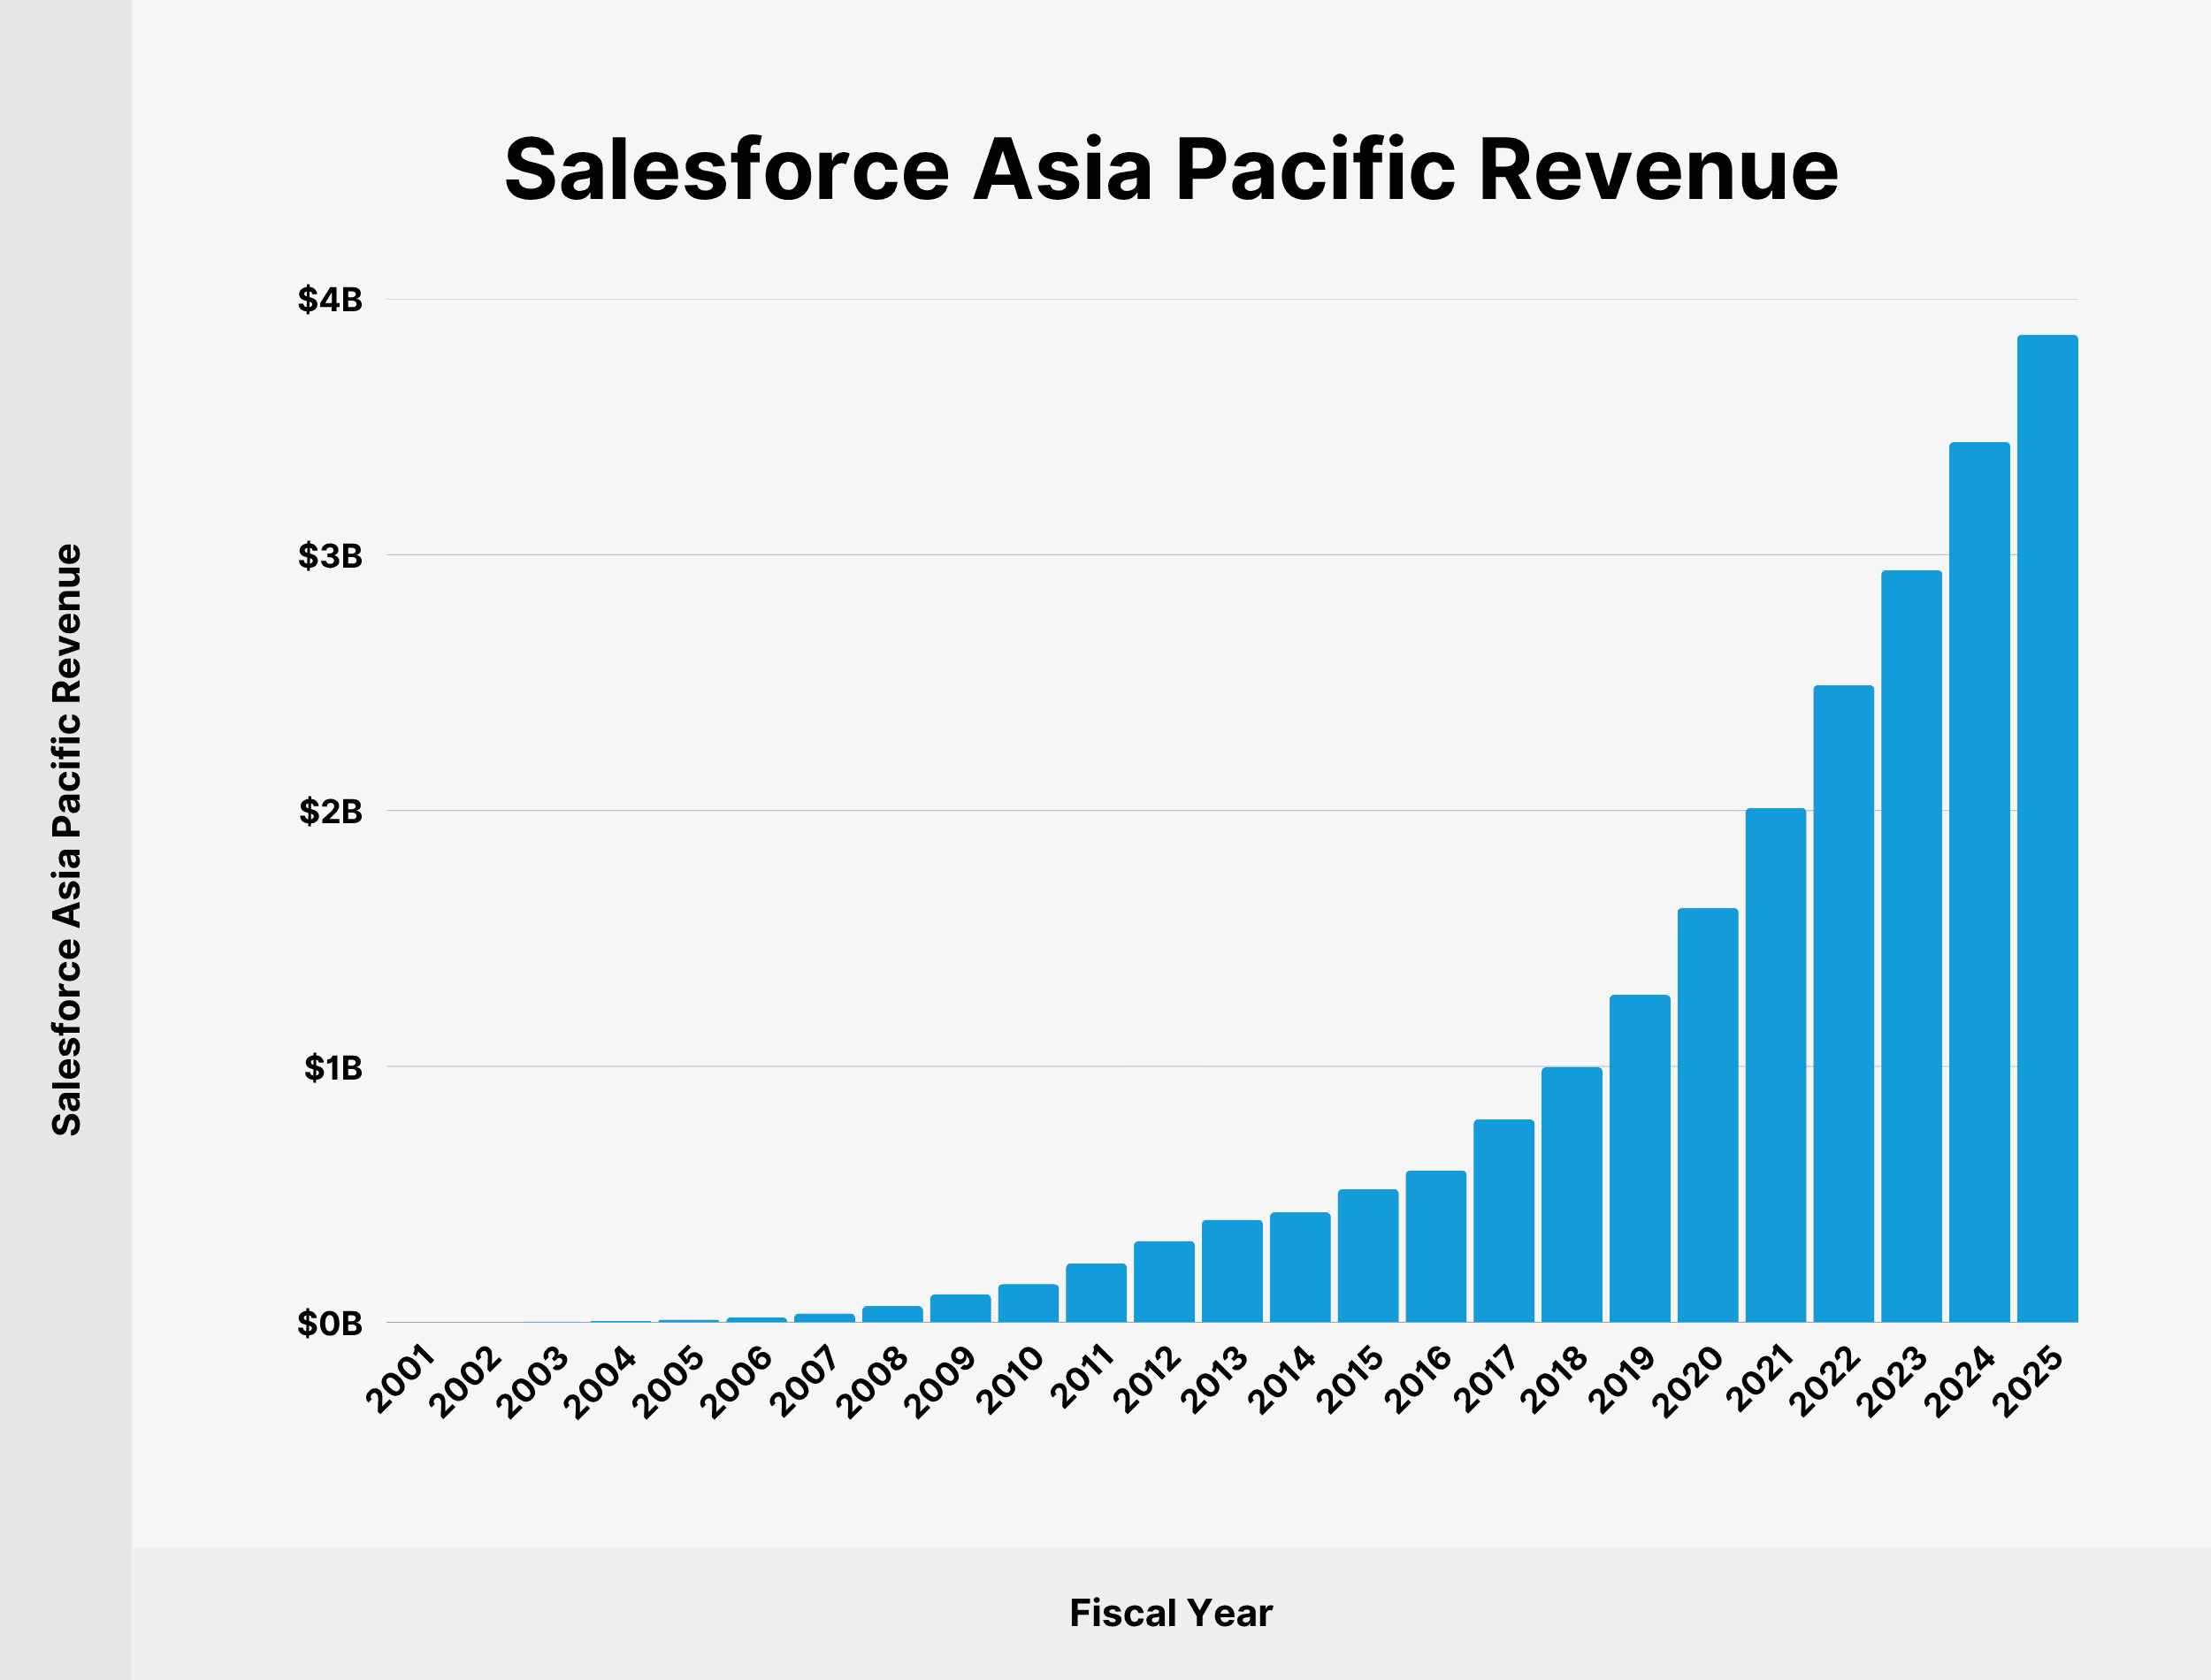
Here’s a table showing Salesforce Asia Pacific revenue since 2001:
| Fiscal Year | Salesforce Asia Pacific Revenue |
|---|---|
| 2001 | $2,000 |
| 2002 | $425,000 |
| 2003 | $1.79 million |
| 2004 | $5.31 million |
| 2005 | $10.3 million |
| 2006 | $19.27 million |
| 2007 | $34.5 million |
| 2008 | $63.71 million |
| 2009 | $109.56 million |
| 2010 | $149.39 million |
| 2011 | $230.34 million |
| 2012 | $317.79 million |
| 2013 | $401.15 million |
| 2014 | $429.95 million |
| 2015 | $520.34 million |
| 2016 | $593.66 million |
| 2017 | $793.47 million |
| 2018 | $997.37 million |
| 2019 | $1.28 billion |
| 2020 | $1.62 billion |
| 2021 | $2.01 billion |
| 2022 | $2.49 billion |
| 2023 | $2.94 billion |
| 2024 | $3.44 billion |
| 2025 | $3.86 billion |
Source: Salesforce
Salesforce Market Share
Salesforce is the largest single player in the CRM applications market. It holds a 20.7% market share.
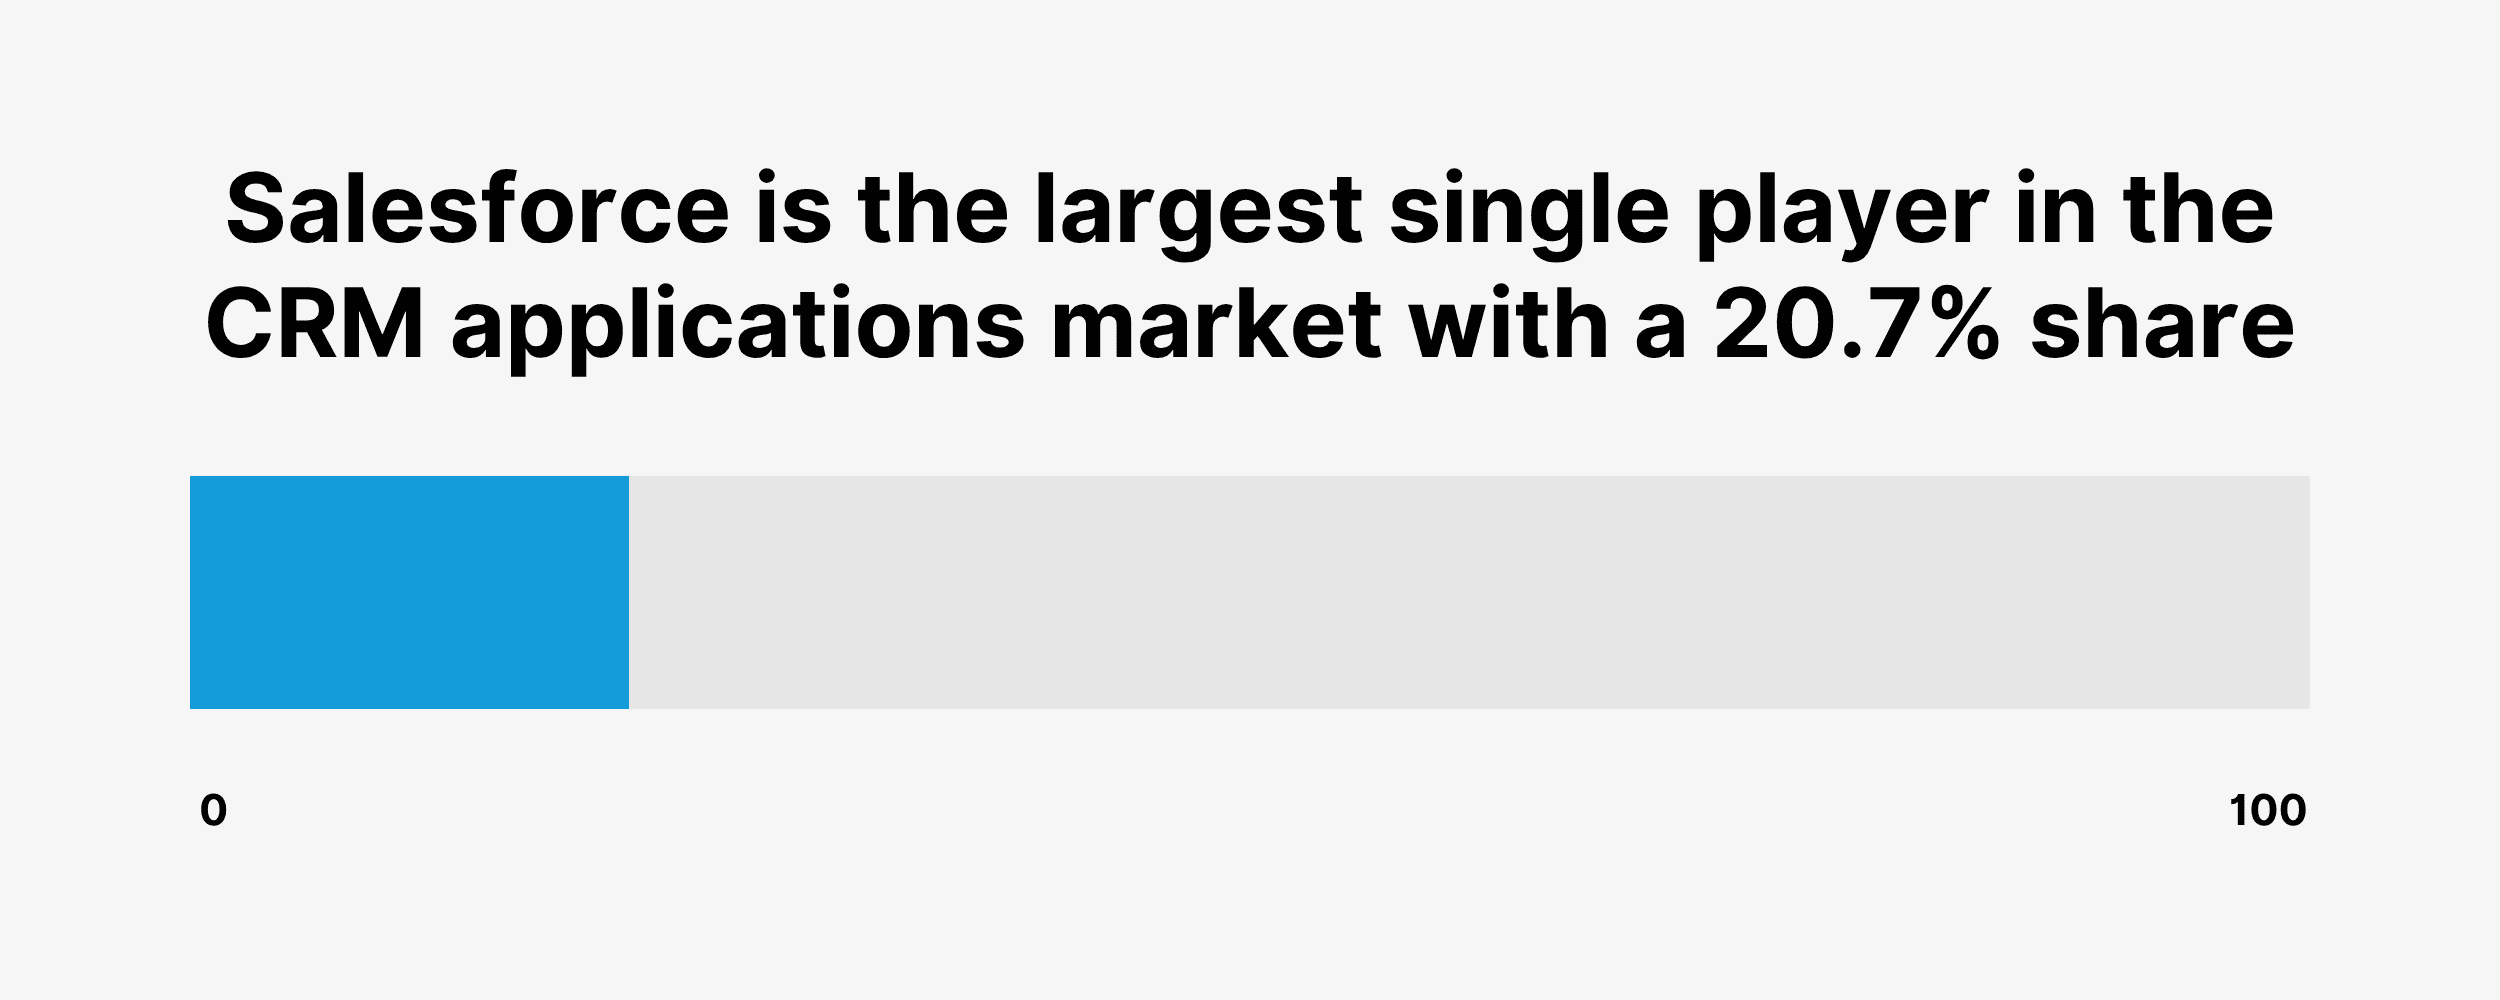
Here’s a table showing the Salesforce share of the CRM market since 2017:
| Year | Salesforce Market Share |
|---|---|
| 2017 | 19.6% |
| 2018 | 16.8% |
| 2019 | 18.4% |
| 2020 | 19.5% |
| 2021 | 23.8% |
| 2022 (H1) | 22.9% |
| 2023 | 21.8% |
| 2024 | 20.7% |
Source: Salesforce
How Many People Work at Salesforce?
Salesforce has 76,453 employees worldwide. Around half of employees (51%) are based in the United States, while the remaining 49% are located internationally.
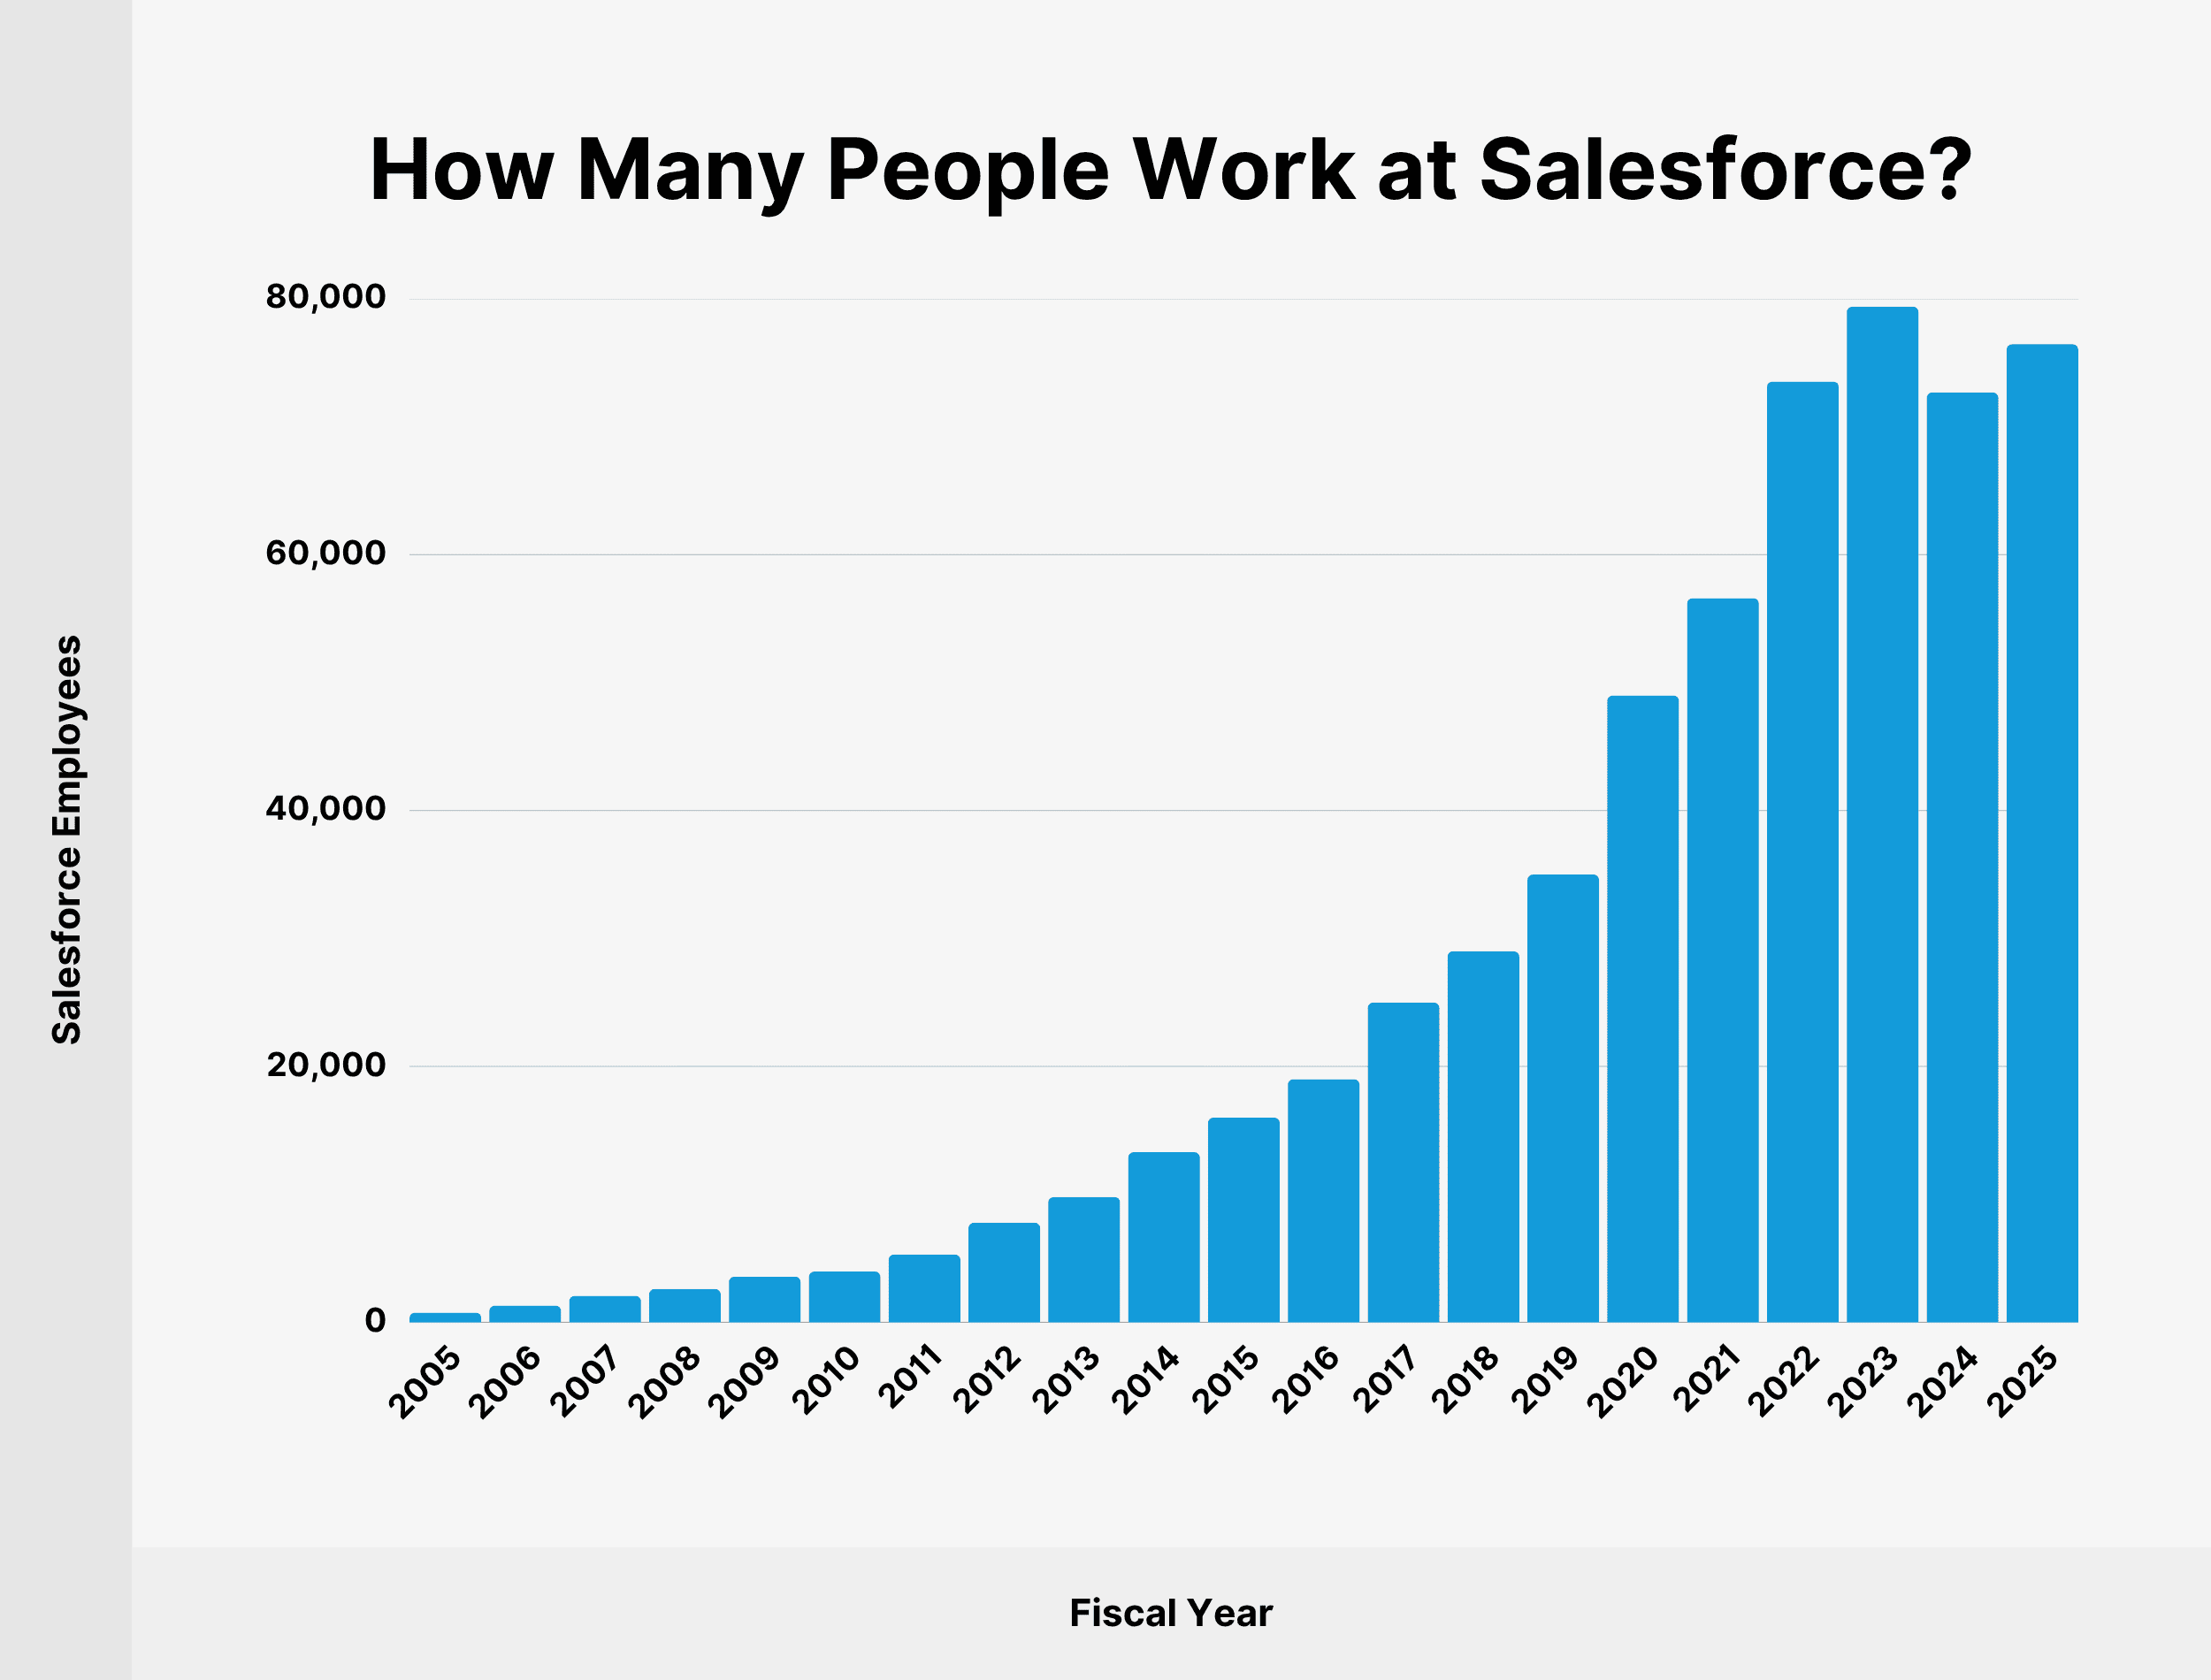
Salesforce’s headcount increased by 5.19% over the past year.
Here’s a table with the number of Salesforce employees worldwide since 2005:
| Fiscal Year | Salesforce Employees |
|---|---|
| 2005 | 767 |
| 2006 | 1,304 |
| 2007 | 2,070 |
| 2008 | 2,606 |
| 2009 | 3,566 |
| 2010 | 3,969 |
| 2011 | 5,306 |
| 2012 | 7,785 |
| 2013 | 9,800 |
| 2014 | 13,300 |
| 2015 | 16,000 |
| 2016 | 19,000 |
| 2017 | 25,000 |
| 2018 | 29,000 |
| 2019 | 35,000 |
| 2020 | 49,000 |
| 2021 | 56,606 |
| 2022 | 73,541 |
| 2023 | 79,390 |
| 2024 | 72,682 |
| 2025 | 76,453 |
Among Salesforce employees working in the US on an H1-B visa, the median base salary is $168,000.
Sources: Macrotrends, H1B Salary Database, Salesforce
Conclusion
That’s it for my list of Salesforce stats for 2026.
With an annual revenue of $37.9 billion, Salesforce has grown into a genuine industry giant. Hopefully, you’ve learned something new about where the company stands today — and how it got there.
As businesses around the world continue to invest in digital transformation, Salesforce looks well-positioned to continue being a leader in the CRM market.
Backlinko is owned by Semrush. We’re still obsessed with bringing you world-class SEO insights, backed by hands-on experience. Unless otherwise noted, this content was written by either an employee or paid contractor of Semrush Inc.

