65 Content Marketing Stats Every Marketer Needs to Know
This is a list of up-to-date content marketing statistics.
On this page, we’ve compiled statistics on:
- Blogging
- Video content
- Social media marketing
- Podcasting
- Emerging trends
- Lots more
Let’s get right into the stats!
01. Blogging Statistics
Despite the rise of video and social media, blogging and SEO are the two foundations of any content strategy in 2026. And there’s data to back this up. As you’re about to see, pro marketers put the lion’s share of their time and budget into creating content designed to rank in Google. The question is: how well does blogging work in 2026? Let’s find out.
- Blogs rank as the most widely used content type for demand generation purposes among content marketers (Semrush)
- The average blog post contains 1,333 words (Orbit Media)

- It takes writers an average of 3 hours and 25 minutes to write a blog post, down from a peak of 4 hours and 10 minutes in 2022 (Orbit Media)
- Bloggers report “strong” content marketing results in 21% of the time, compared to 11% who report “disappointing” returns (Orbit Media)
- 66% of content marketers use AI to generate blog ideas and suggest edits (Orbit Media)
- Blog posts with 7 or more images generated 55% more backlinks in comparison to posts without images (Semrush)
02. Video Content Marketing Statistics
Online video is exploding right now. As you’re about to see, most of this growth is on YouTube. But other platforms (like Facebook and Instagram) are catching up fast.
- More than half of marketers use social videos (77%), branded stories (61%), and how-to videos (59%) in their video marketing initiatives (Content Marketing Institute)
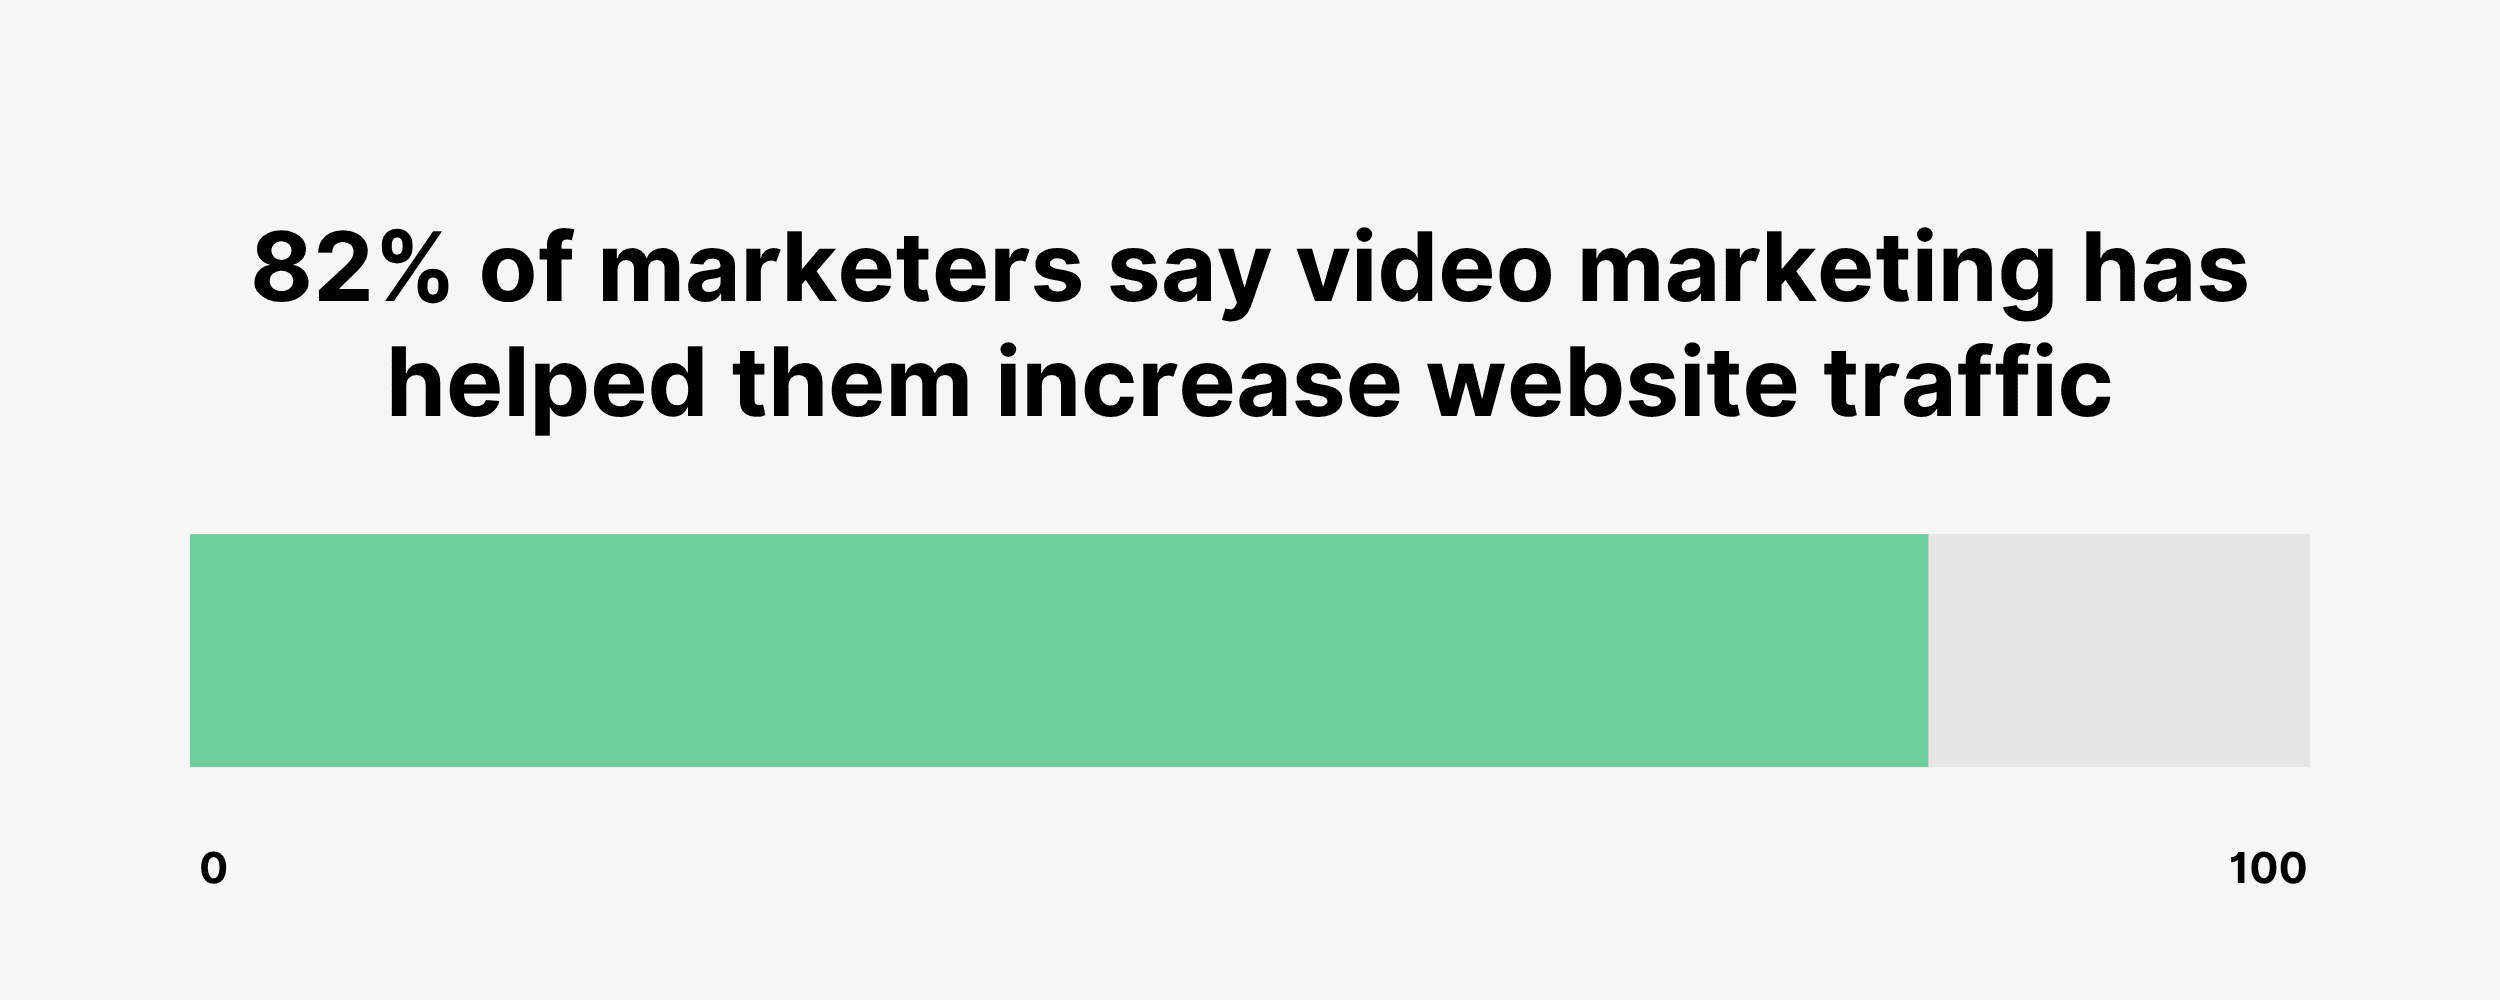
- 82% of marketers say video marketing has helped them increase website traffic, down from 91% in 2023 (Wyzowl)

- 84% of marketers claim that results from videos meet or exceed their expectations (Content Marketing Institute)
- Marketers report that YouTube (85%), LinkedIn (84%), and Facebook (67%) are the top 3 social platforms to distribute video content (Content Marketing Institute)
- 83% of consumers say they would like more video content from brands in 2025 (Wyzowl)
- 78% of consumers said that a short video was their favorite medium to learn about a product or service (Wyzowl)
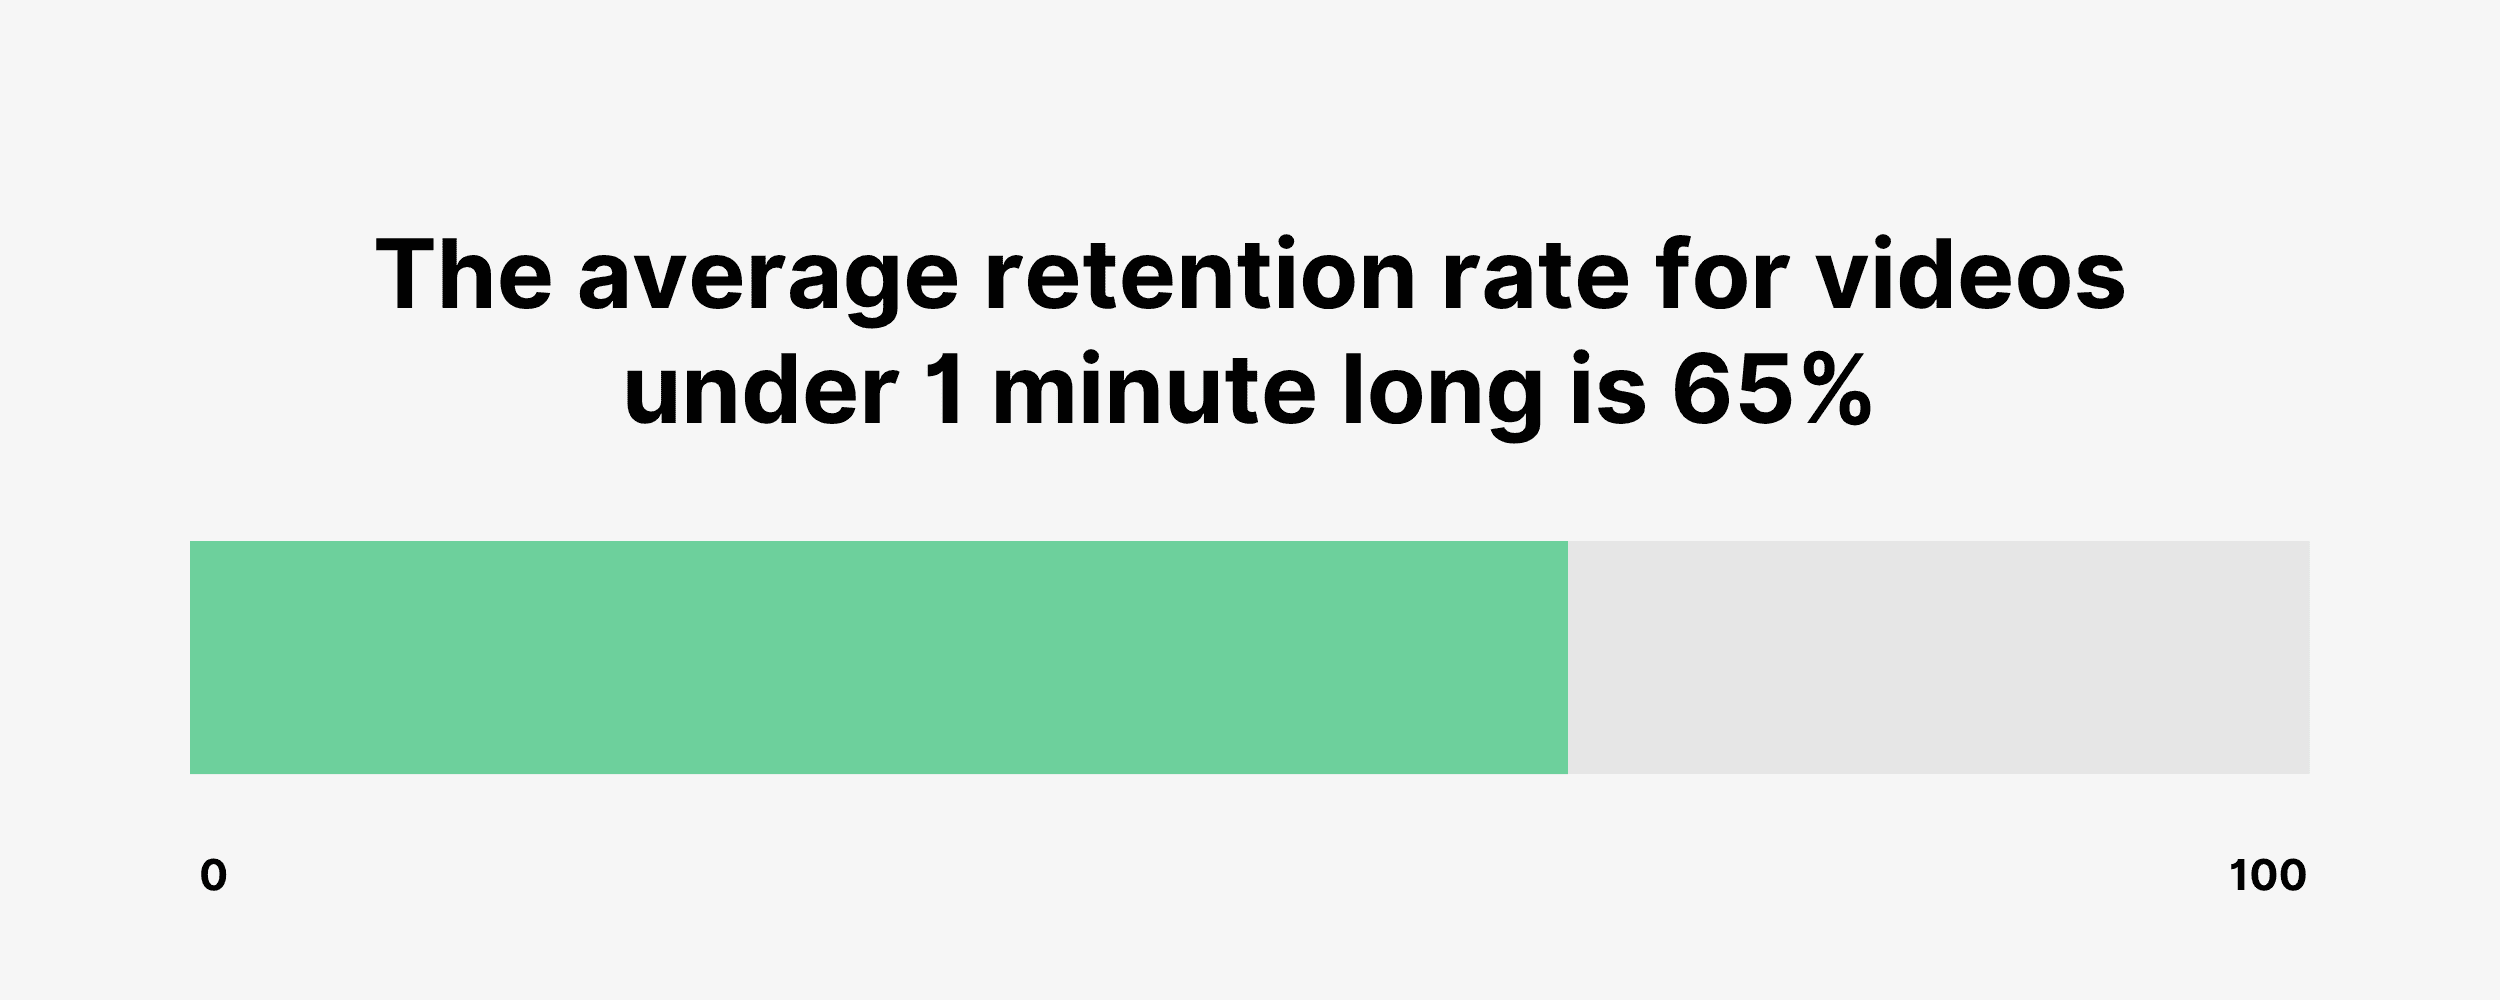
- The average retention rate for videos under 1 minute long is 65% (Vidyard)

- Globally, YouTube’s Android app users spend over 10 trillion minutes per month watching videos. (DataReportal)
03. Podcast Statistics
Now it’s time to cover content marketing statistics that are focused on podcasts. What’s interesting about podcasts is how quickly they went from a niche form of content to a mainstream medium. These podcasting statistics show just how big this platform is… and how it has the potential to grow even more.
- 78% of Americans (ages 12+) listen to podcasts monthly. That’s an estimated 228 million podcast listeners in the US (Edison Research)
- On average, weekly podcast listeners listened to 8.3 podcast episodes in the past week (Edison Research)
- The average time spent per day with podcasts among US users amounted to 28 minutes in 2024 (eMarketer)
- Spotify accounts for 31.8% of podcast listeners in the US (eMarketer)

- Spotify, iHeartRadio, and Apple Podcasts combined account for 77.4% of US podcast listeners (eMarketer)
- Podcasts now account for 26.4% of total time spent with digital audio (eMarketer)
- Millennials currently account for 32.7% of podcast consumers in the US, totaling 44.3 million individuals, with Generation Z following closely at 28.9% (39.1 million people) (eMarketer)
- US podcast ad spending was estimated to hit $3.25 billion in 2024 and $3.98 billion by 2025 (eMarketer)
- On average, internet users worldwide spend 2 hours and 21 minutes a day on social media (DataReportal)

- Facebook is still the top social media platform used by marketers, followed by Instagram and LinkedIn (Statista)
- A study conducted by Rival IQ found that the median engagement rate on Instagram is 0.36%, compared to only 0.046% on Facebook and 0.015% on X/Twitter (Rival IQ)
- The best times to post on Facebook are weekdays between 9 am and 6 pm (Sprout Social)
- The best times to post on Instagram are also weekdays between 9 am and 6 pm (Sprout Social)
- The best time to post on X/Twitter is Tuesday through Thursday between 10 am and 5 pm (Sprout Social)
- The best times to post on LinkedIn are Tuesday through Thursday between 8 am and 12 pm (Sprout Social)
- As of February 2025, here is the number of global active users by each of the major social channels: Facebook (3.07 billion), Instagram (3 billion), WhatsApp (3 billion), YouTube (2.58 billion), TikTok (1.99 billion), and WeChat (1.41 billion) (Statista)
- Content containing 1,000-2,000 words generates an average of 56.1% more shares on social media compared to content with fewer than 1,000 words (Backlinko)

- 1.3% of all articles published online receive 75% of all social shares (Backlinko)
05. B2B Content Marketing Statistics
If you’re in B2B, you already know that you need to approach content marketing differently than in B2C. And I’m not talking about pushing out tons of white papers. It’s 2026 after all!
That’s not to say that content marketing in B2B is any less effective than it used to be. You just need to create content for people who are going to consume that content (and possibly convert) at work. This list of content marketing stats focused on the B2B world gives some insight into how this plays out in the real world.
- 53% of B2B marketers say case studies/customer stories and videos produce the best results (Content Marketing Institute)

- Short articles and videos rank as the most widely used content formats among B2B marketers in the last 12 months (Content Marketing Institute)
- When it comes to most effective content distribution channels, more than half of B2B marketers say in-person events (56%) and webinars (51%) deliver the best results (Content Marketing Institute)
- The top three commonly used metrics to evaluate content performance are conversions (73%), email engagement (71%), and website traffic (71%) (Content Marketing Institute)
- According to 84% of B2B marketers, content marketing has proven to be helpful in generating brand awareness over the past 12 months (Content Marketing Institute)
- Over 7 in 10 (72%) of B2B marketers claim to use generative AI tasks for content tasks (Content Marketing Institute)

- 51% of B2B marketers use AI tools to brainstorm new topics. Some marketers use AI to research keywords, headlines (45%), and write drafts (45%) (Content Marketing Institute)
- More than half (57%) of B2B marketers say “creating the right content for our audience” is a challenge. Other common challenges include creating content consistently (54%), differentiating content (54%), and optimizing for SEO (45%) (Content Marketing Institute)
- 93% of content on B2B sites gets zero links from other sites (Backlinko)

- Only 3% of content on B2B sites receives links from multiple websites (Backlinko)
- 2% of articles created by B2B brands result in 75% of social shares of all B2B content (Backlinko)
- Less than half (41%) of B2B marketers have a documented content marketing strategy (Gartner)
- 49% of US B2B marketers say content marketing is the most effective channel for driving revenues (eMarketer)
06. B2C Content Marketing Statistics
Now it’s time to cover a handful of B2C content marketing statistics. So if you’re in fitness, health, fashion, or other B2C industries, you’ll probably be super interested in these stats.
- Only 37% of B2B marketers have a documented content marketing strategy. Another 36% of respondents say they have it, but it’s not documented (Content Marketing Institute)
- B2C content produces 9.7x more shares than content on B2B sites (Backlinko)

- 89% of B2B marketers use organic social media platforms for content distribution. By comparison, 84% use blogs on corporate websites, 71% use email newsletters, and 63% use email (Content Marketing Institute)
- Only 26% of B2B marketers believe their organization has the appropriate technology to manage content. While 38% percent think they have the tech, but aren’t utilizing it to its full potential. (Content Marketing Institute)
- 84% of B2C marketers used paid methods to distribute their content during the last 12 months (Content Marketing Institute)
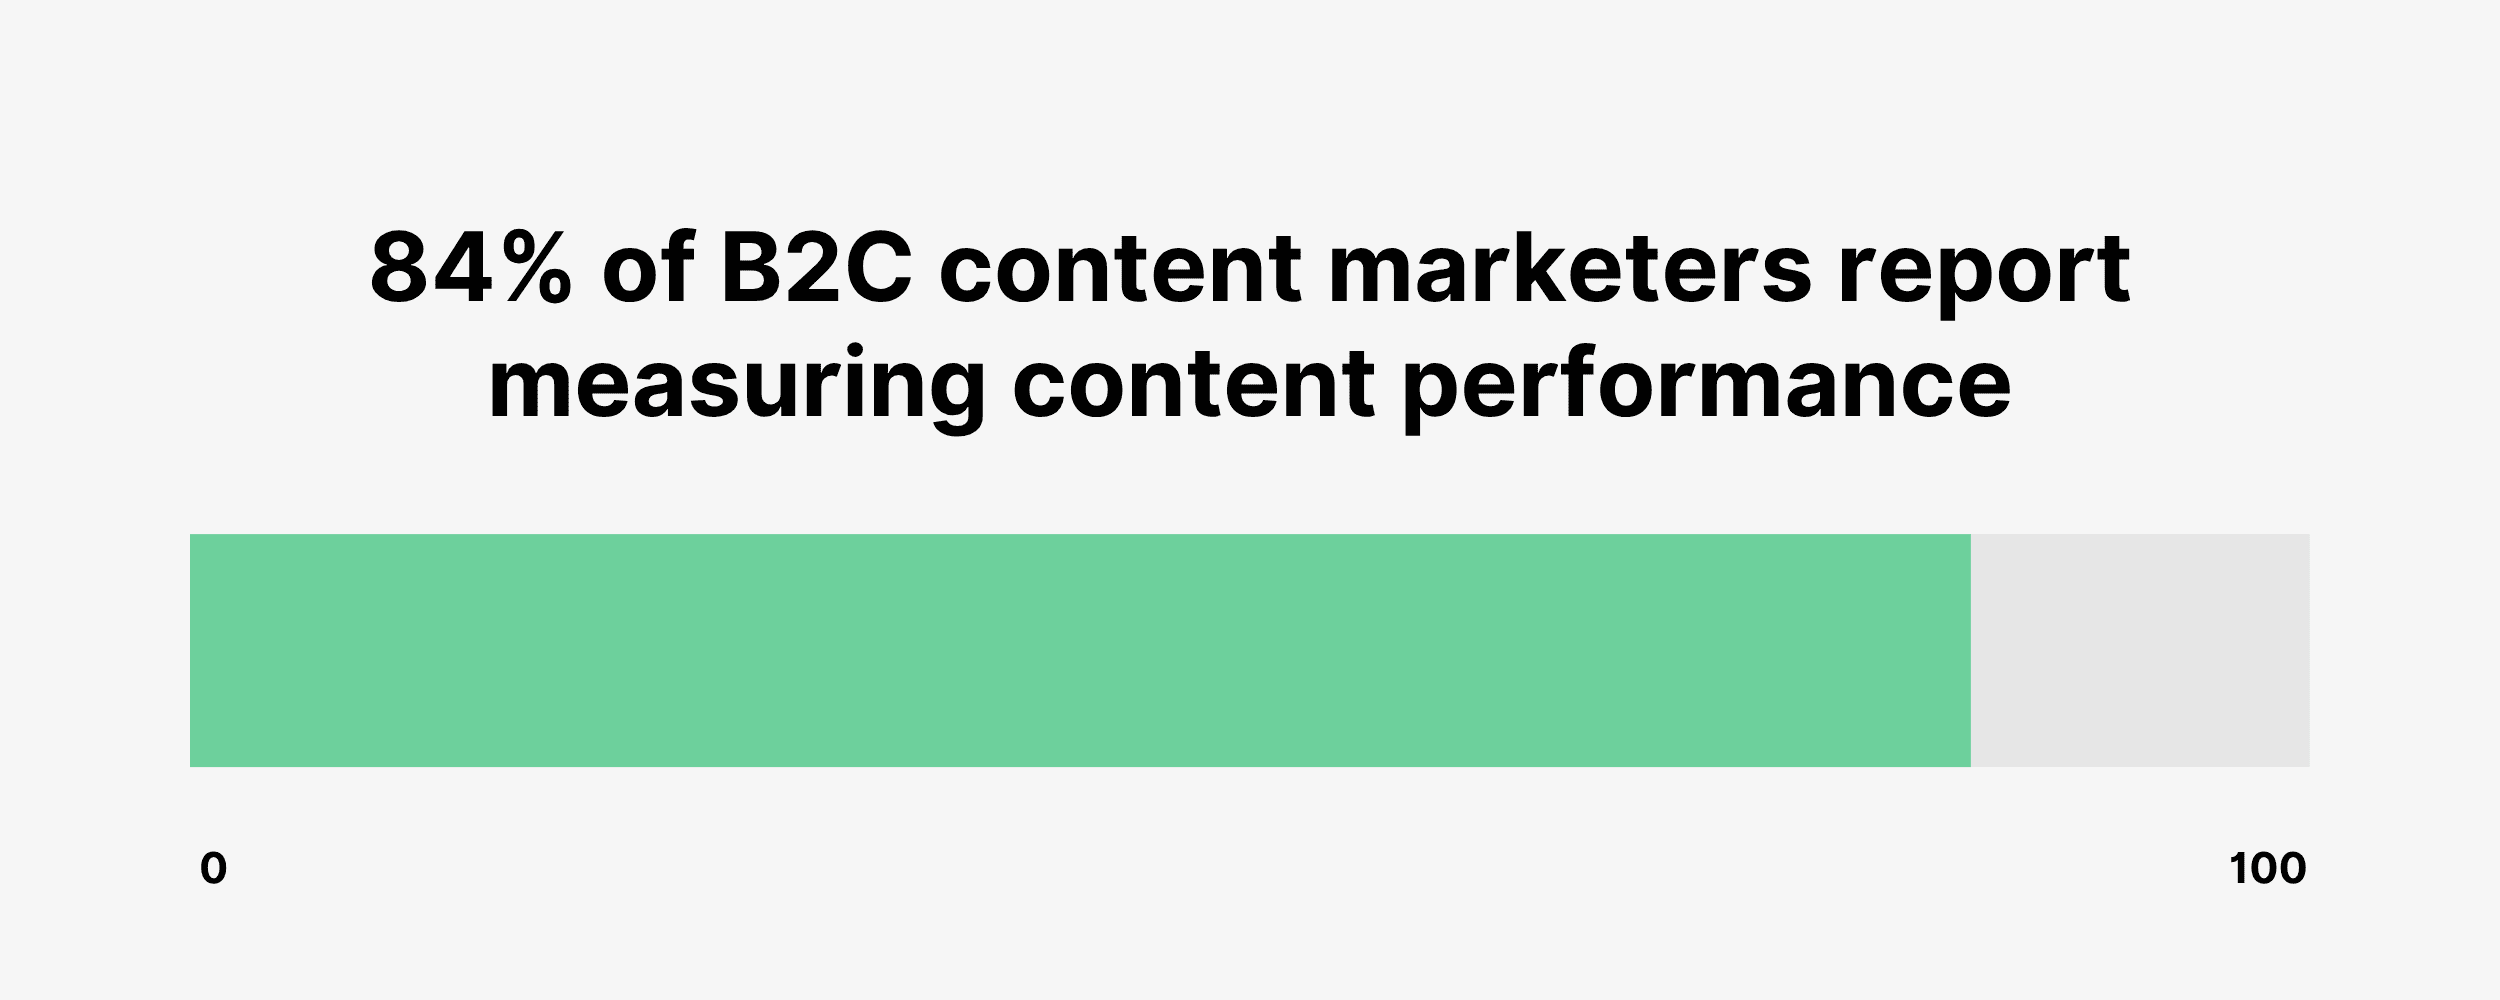
- 84% of B2C content marketers report that their organization measures content performance effectively (Content Marketing Institute)

- The top paid channels that B2C marketers use as part of their content marketing strategy: social media advertising/promoted posts (73%) and search engine marketing (SEM)/pay-per-click (64%) (Content Marketing Institute)
- Around one-third (31%) of B2C marketers disclosed that their organization invests 50% or more of its total marketing budget in content marketing (Content Marketing Institute)
- 65% of B2C marketers say they “frequently” or “always” differentiate content from their competitors (Content Marketing Institute)
07. Content Marketing Benchmarks & Trends
Let’s wrap things up with a slew of interesting stats that show how content fits into the digital marketing landscape. And where it may be heading.
- 38% of CMOs plan to increase content marketing budgets at their organizations in 2024 (Matter Communications)
- 33% of marketing professionals say content marketing had the biggest impact on their multi-channel strategy, which is behind social media (55%), digital advertising (41%), and email marketing (36%) (Ascend2)

- An overwhelming majority (94%) of blog posts earn zero external links (Backlinko)
- The average annual salary for content marketers in the US amounts to $112,000 (Content Marketing Institute)
- The most common challenges faced by marketers when it comes to content marketing include finding ideas for new content (16%), creating content that receives high levels of engagement (16%), and creating content that attracts more website traffic (15%) (HubSpot)
- Articles with at least one video received 70% more traffic compared to articles without videos (Semrush)

- According to 83% of marketers, content marketing is the most effective strategy for demand generation (Content Marketing Institute)
- The top goals companies have for their content marketing efforts are brand awareness and building loyalty among existing customers (Statista)
Conclusion
I hope you learned something new from my list of content marketing statistics.
In conclusion, these content marketing statistics shed light on the evolving landscape of digital marketing.
From the increasing importance of visual content to the rise of video consumption, businesses must adapt their strategies to remain relevant and engaging to their audiences.
04. Social Media Marketing Statistics
Social media and content marketing go hand in hand. First of all, a lot of the content that people produce is specifically for social media platforms, like Facebook and YouTube. Also, social media is an important distribution channel for content that people publish on their own websites. Now it’s time to see what the data says about how social media marketing impacts content marketing.