The Google Chrome web browser was publicly released in 2008.
Originally only available for Microsoft Windows, support for macOS, Linux, and mobile platforms quickly followed.
By mid-2012, Chrome was the most popular browser worldwide. It has been the dominant player in the category ever since.
Read on to discover all of the important Google Chrome statistics for 2026. Here’s a summary of what we’ll cover:
- Chrome Stats (Top Picks)
- Chrome Market Share Worldwide
- Chrome Market Share in the US
- Number of Chrome Users
- Number of Chrome Extensions
- Number of Chrome Extensions Developed by Google
- Chrome App Downloads
Chrome Stats (Top Picks)
- Chrome is used by 3.83 billion internet users. That’s up from 3.06 billion in 2020.
- Chrome has a worldwide browser market share of 67.72%.
- In the US, the Chrome share of browser usage is 52.23%.
- Over 110,000 extensions are available for Chrome.
Chrome Market Share Worldwide
Google Chrome has a global browser market share of 67.72% across all device types. A slight increase from the 65.82% share registered in 2024.
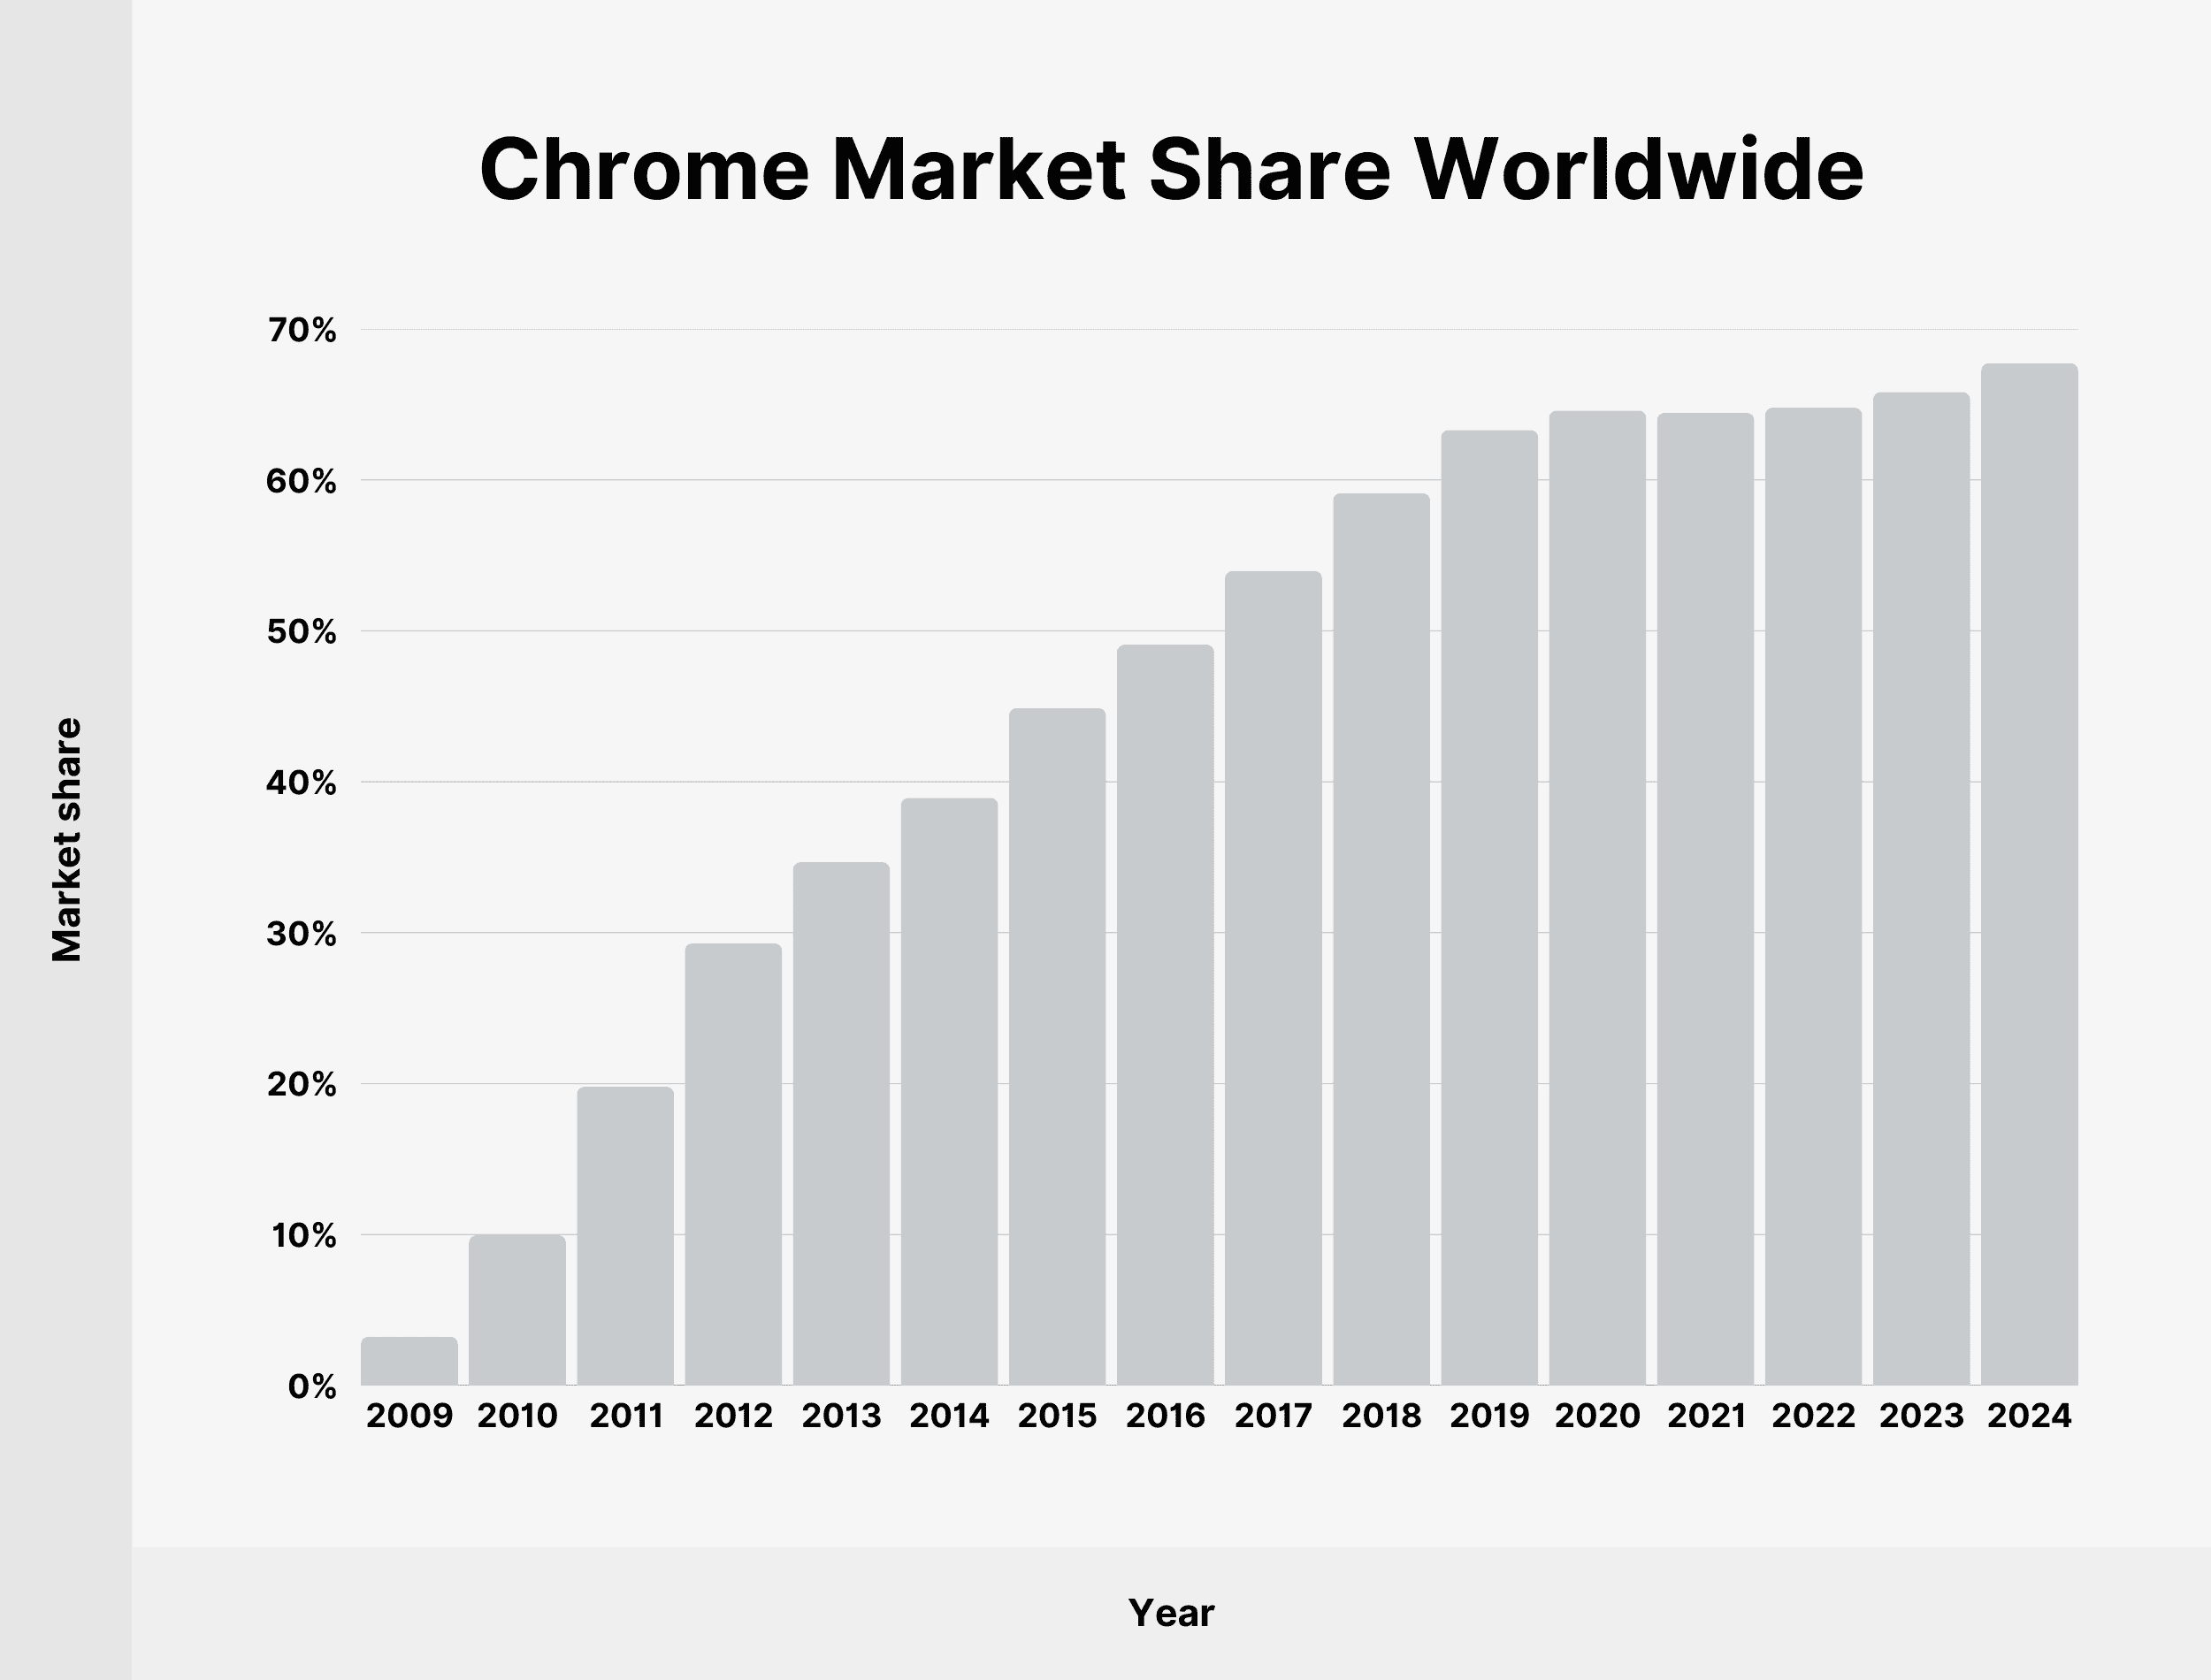
For comparison, the second most popular browser worldwide (Safari) has a market share of 16.64%.
Here’s a table showing the Google Chrome browser market share (across all device types) since 2009:
| Year | Market share |
|---|---|
| 2009 | 3.23% |
| 2010 | 9.95% |
| 2011 | 19.79% |
| 2012 | 29.3% |
| 2013 | 34.67% |
| 2014 | 38.94% |
| 2015 | 44.87% |
| 2016 | 49.08% |
| 2017 | 53.96% |
| 2018 | 59.12% |
| 2019 | 63.31% |
| 2020 | 64.6% |
| 2021 | 64.45% |
| 2022 | 64.78% |
| 2023 | 63.87% |
| 2024 | 65.82% |
| 2025 | 67.72% |
Among mobile users, Chrome has a slightly higher market share of 68.34%. Chrome’s presence in the mobile browser market has grown significantly in recent years.
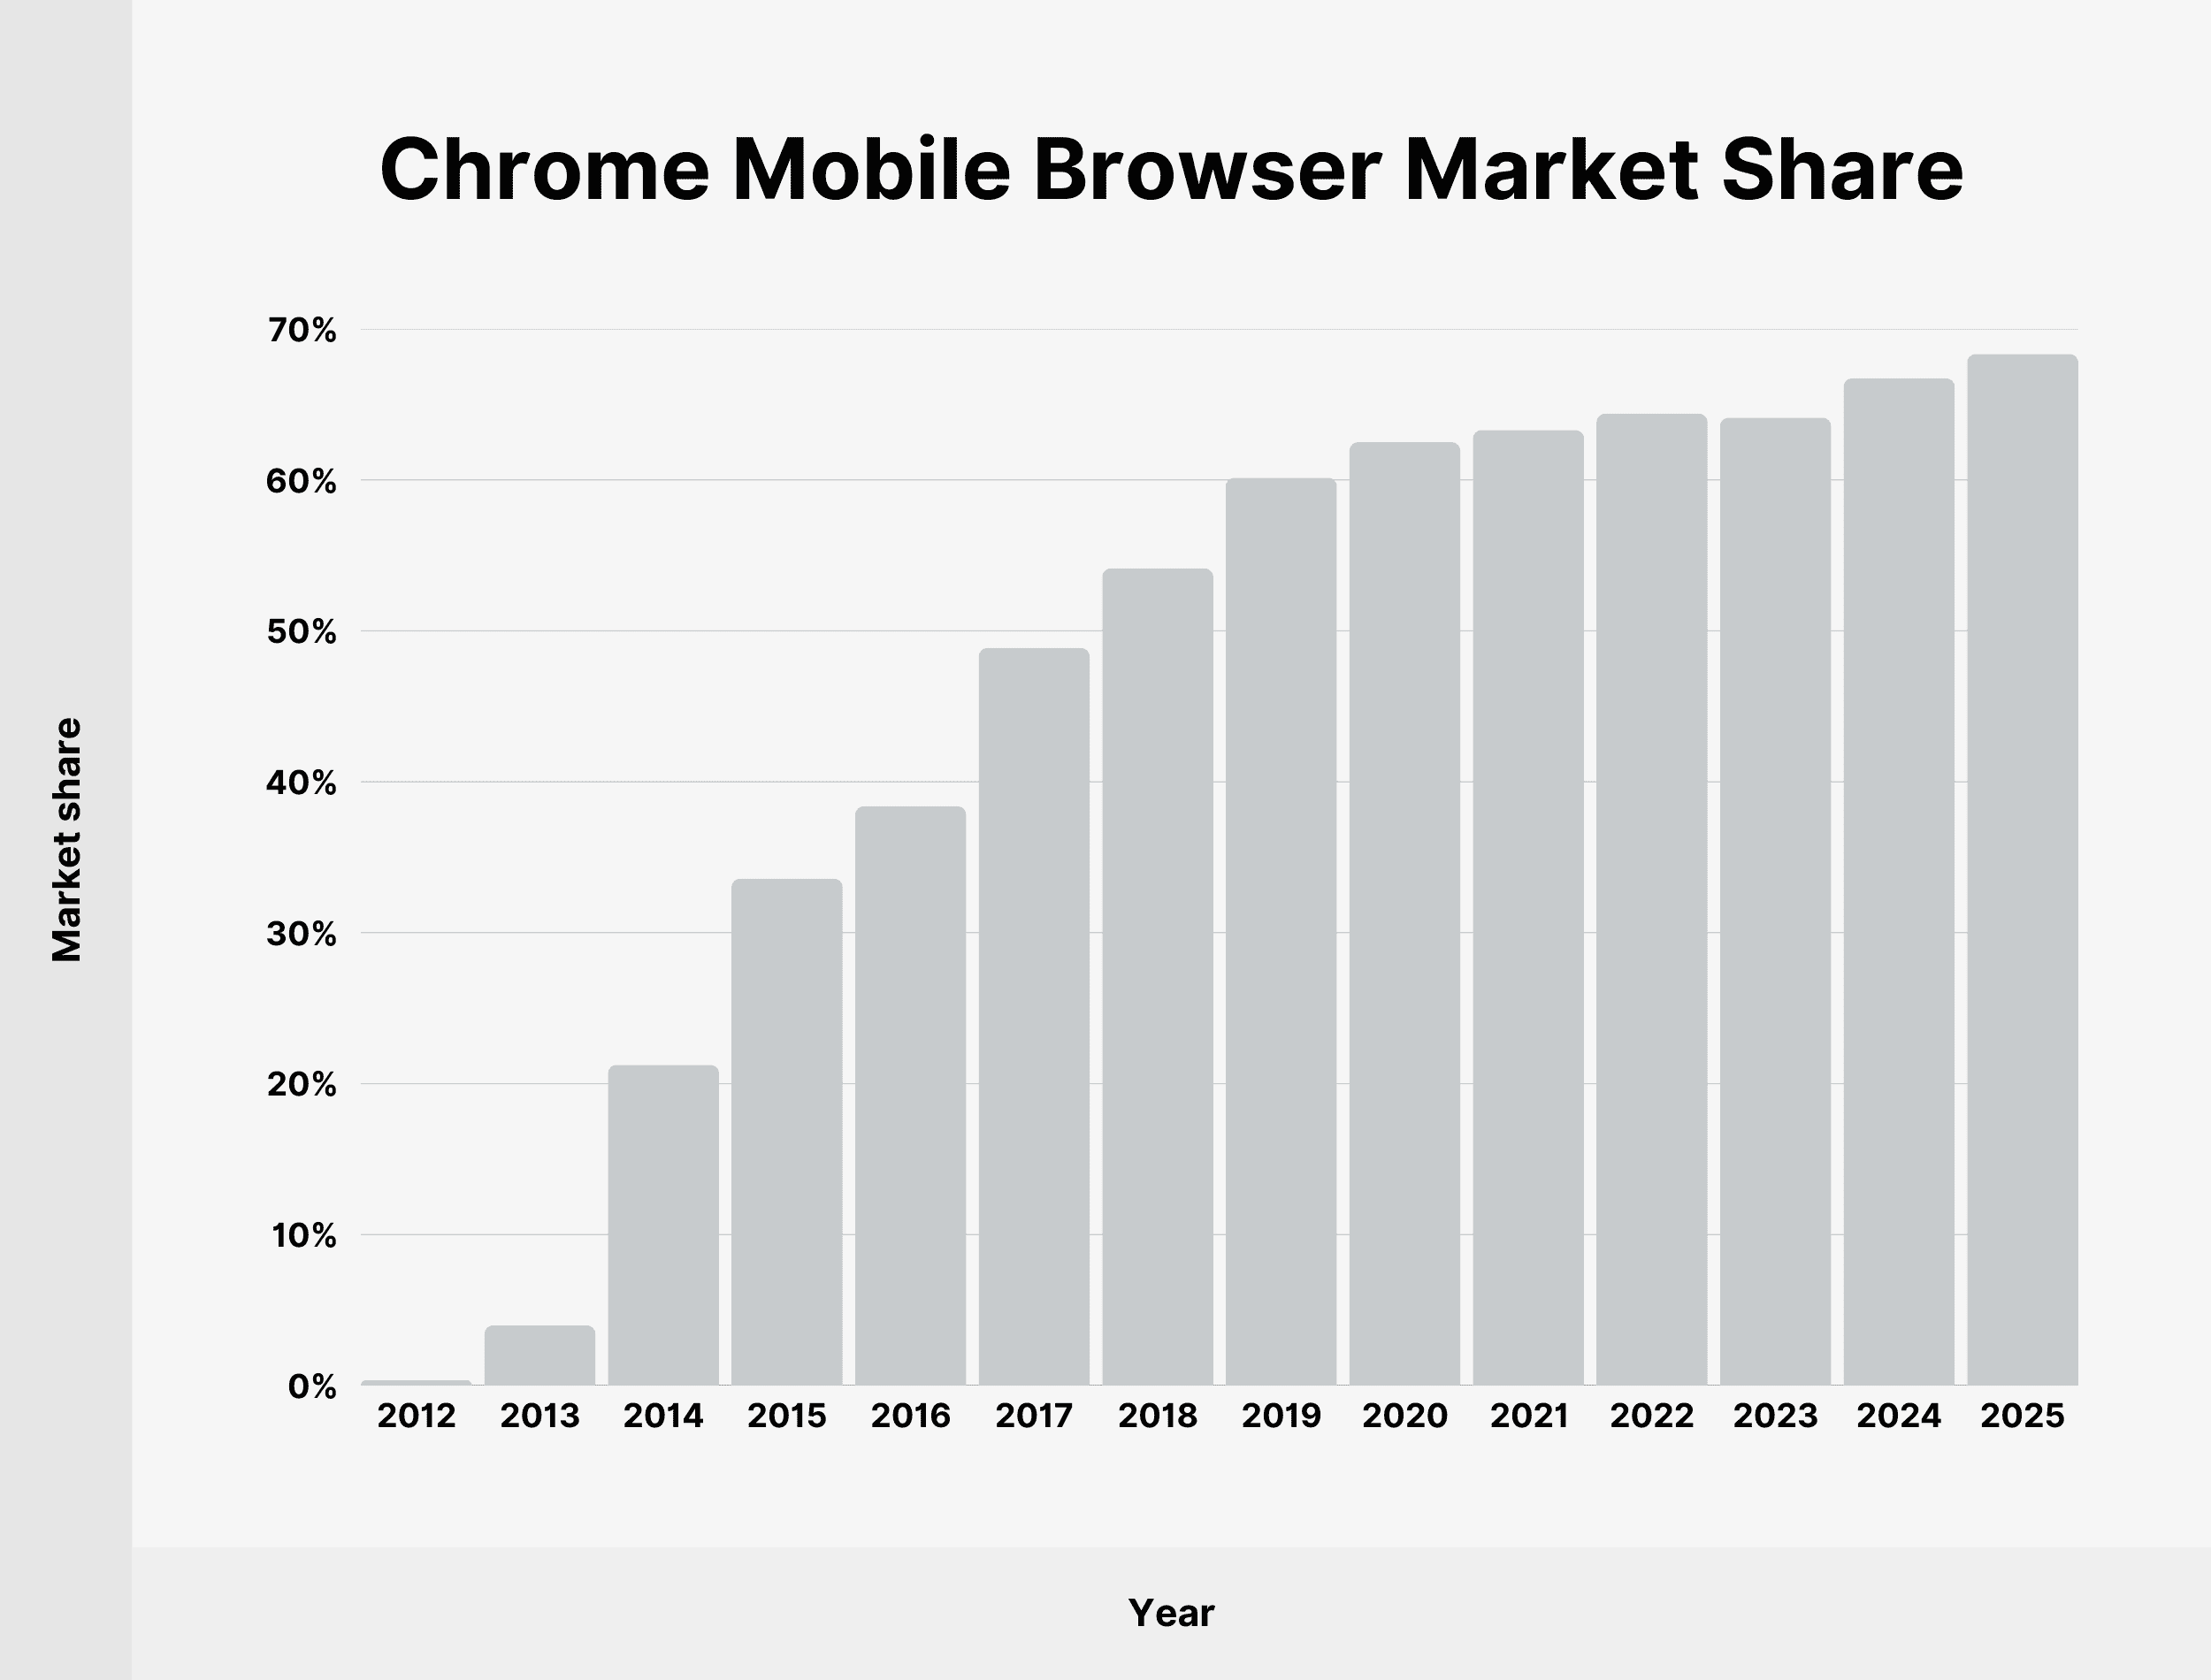
We’ve charted the growth in Chrome’s mobile browser market share since 2012:
| Year | Market share |
|---|---|
| 2012 | 0.35% |
| 2013 | 3.98% |
| 2014 | 21.25% |
| 2015 | 33.58% |
| 2016 | 38.38% |
| 2017 | 48.86% |
| 2018 | 54.14% |
| 2019 | 60.14% |
| 2020 | 62.5% |
| 2021 | 63.3% |
| 2022 | 64.39% |
| 2023 | 64.12% |
| 2024 | 66.74% |
| 2025 | 68.34% |
Chrome has a tablet browser market share of 48.69%, which is the lowest among all device types (excluding game consoles).
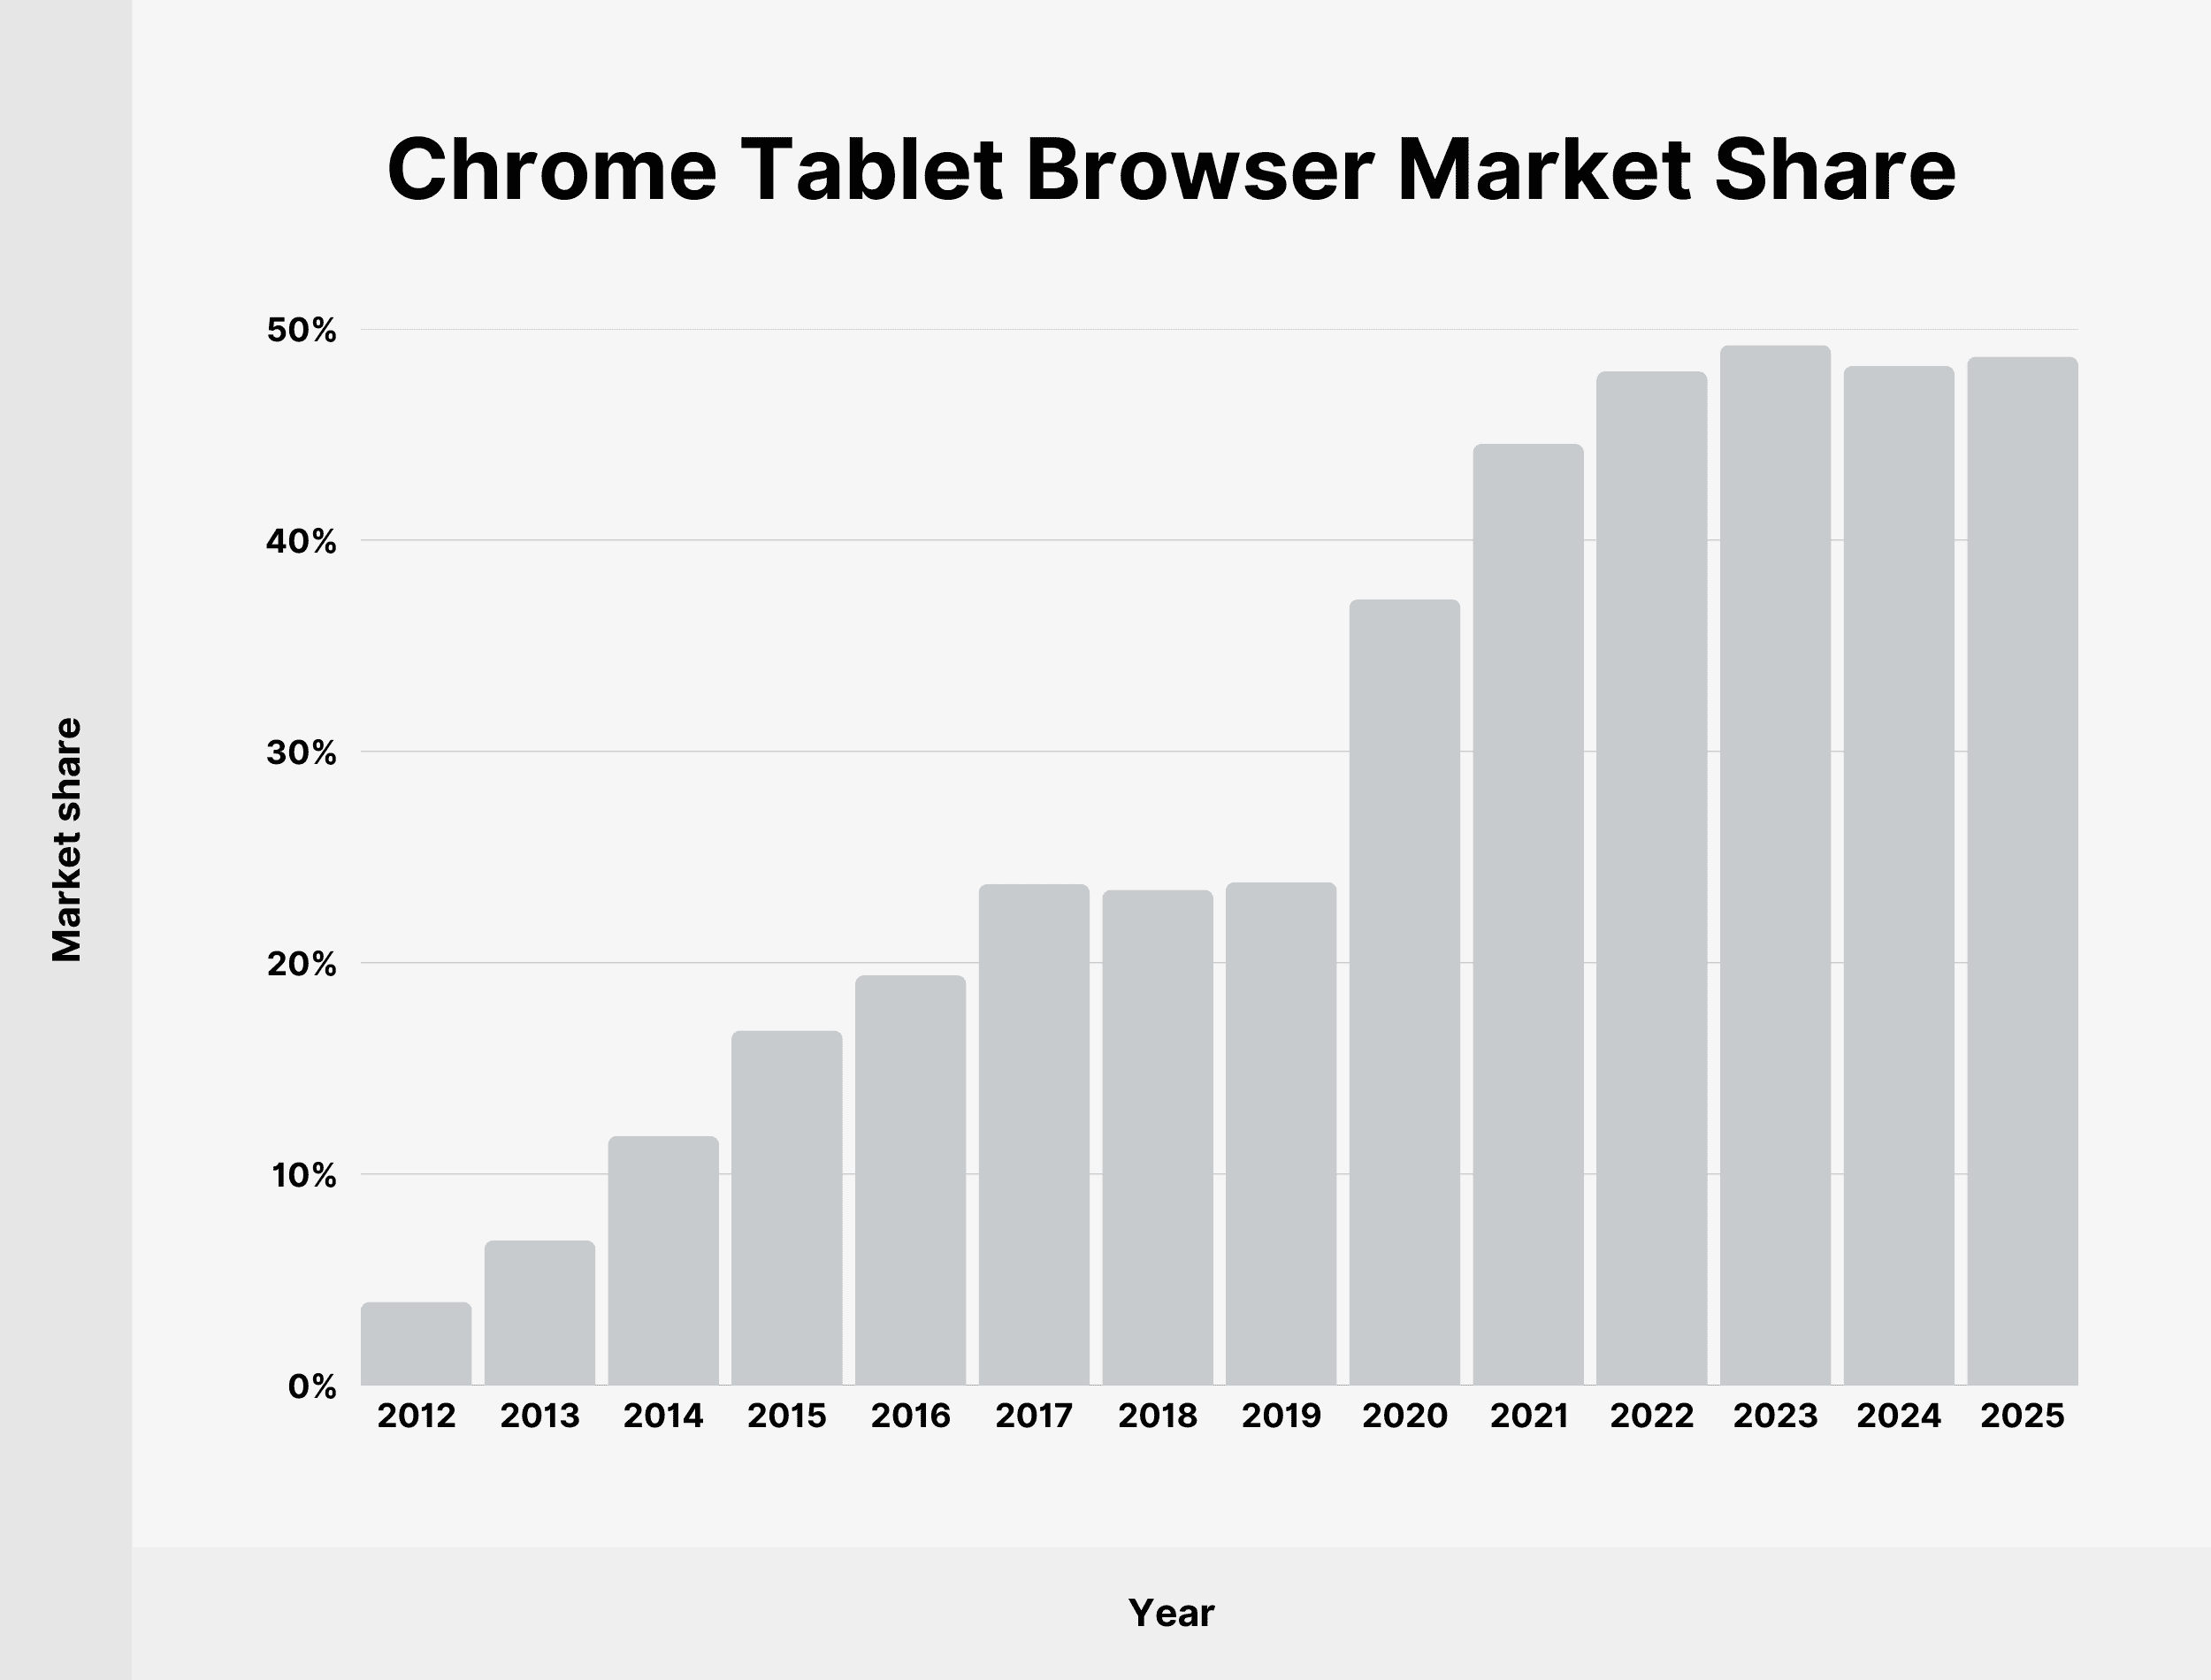
Even so, Chrome is still the most popular browser among tablet users. Safari currently ranks as the second most used browser among tablet users, with a market share of 31.19%.
We’ve prepared a table showing the growth in Chrome browser market share among tablet users:
| Year | Market share |
|---|---|
| 2012 | 3.96% |
| 2013 | 6.87% |
| 2014 | 11.8% |
| 2015 | 16.8% |
| 2016 | 19.41% |
| 2017 | 23.73% |
| 2018 | 23.46% |
| 2019 | 23.82% |
| 2020 | 37.21% |
| 2021 | 44.56% |
| 2022 | 47.99% |
| 2023 | 49.24% |
| 2024 | 48.25% |
| 2024 | 48.69% |
Source: Statcounter GlobalStats
Chrome Market Share in the US
Chrome has a 52.23% share of the US browser market. The US share is significantly lower than the 67.72% cut Chrome enjoys worldwide.
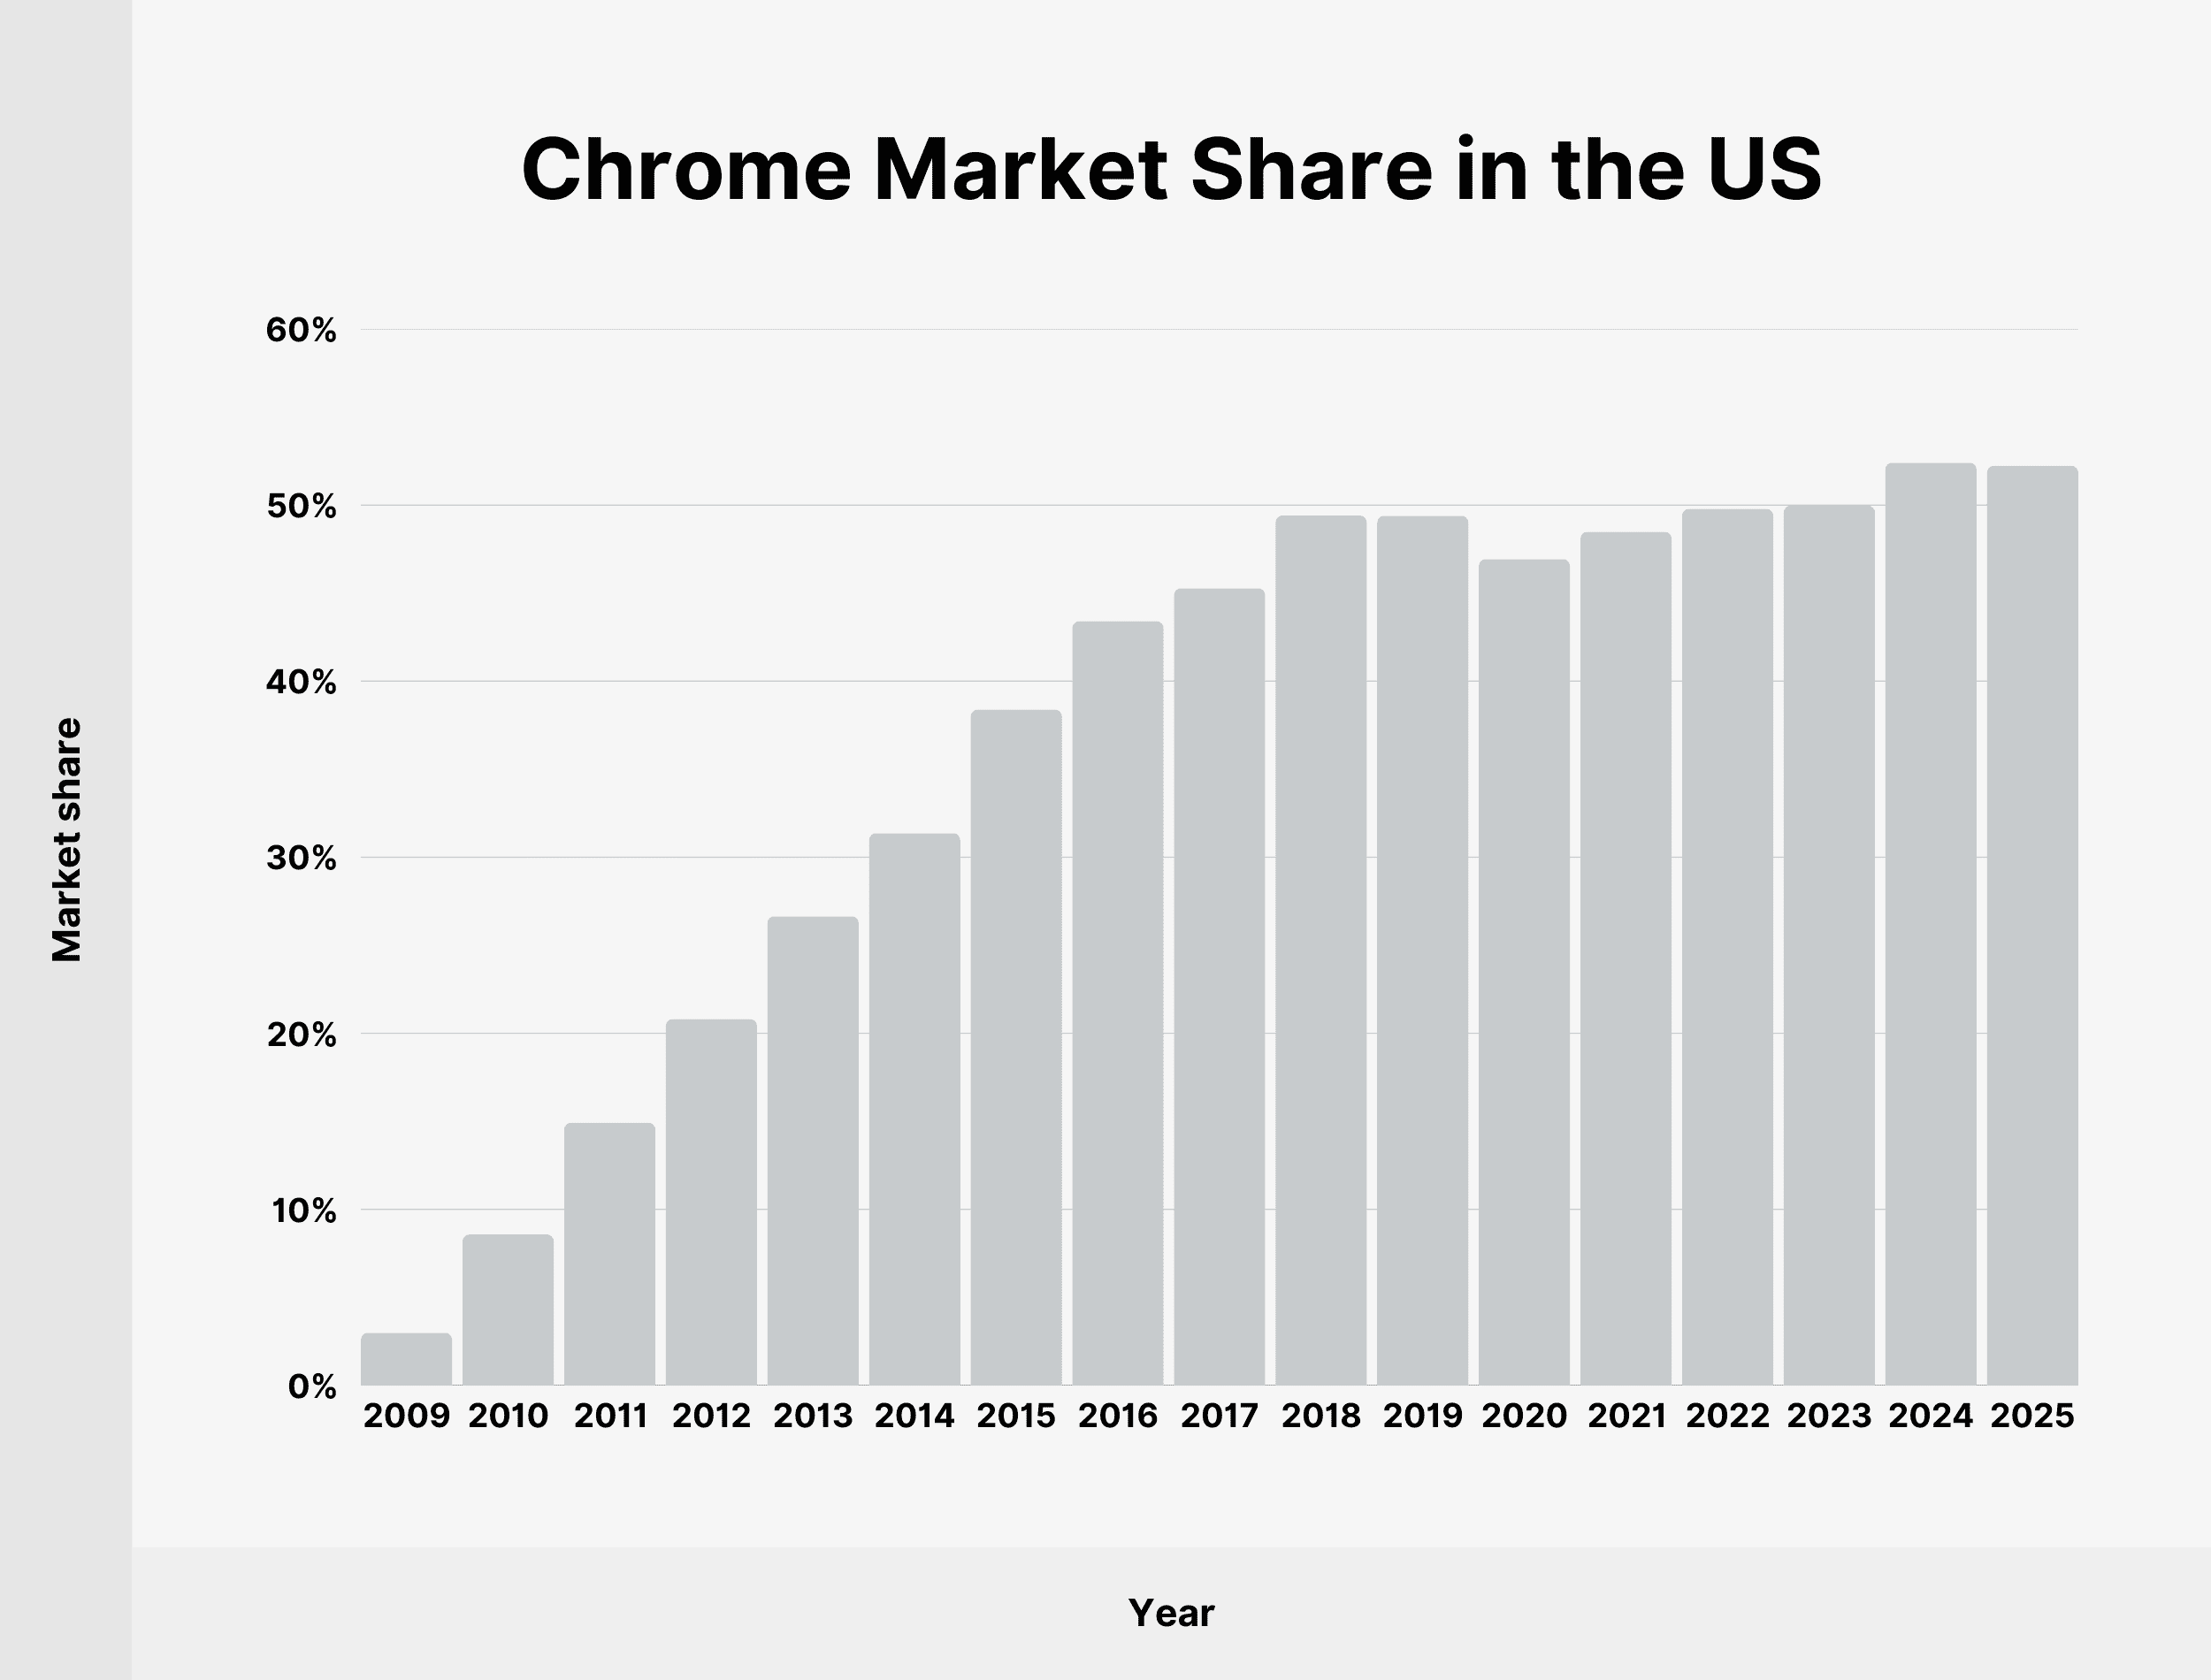
The second most used browser in the US is Safari, which has a 30.6% market share.
Chrome’s US presence has been consistent over the past few years, with over 50% of the market share in the US browser market.
Here’s the historical data on Chrome’s market share in the US since 2009:
| Year | Market share |
|---|---|
| 2009 | 2.99% |
| 2010 | 8.58% |
| 2011 | 14.92% |
| 2012 | 20.81% |
| 2013 | 26.65% |
| 2014 | 31.36% |
| 2015 | 38.38% |
| 2016 | 43.4% |
| 2017 | 45.27% |
| 2018 | 49.4% |
| 2019 | 49.39% |
| 2020 | 46.93% |
| 2021 | 48.48% |
| 2022 | 49.78% |
| 2023 | 49.97% |
| 2024 | 52.41% |
| 2025 | 52.23% |
Chrome holds a majority of the US desktop search market (62.08%). Edge, the closest competitor, has a market share over 4x smaller (13.78%), while Safari now ranks third (12.21%) among desktop users in the US.
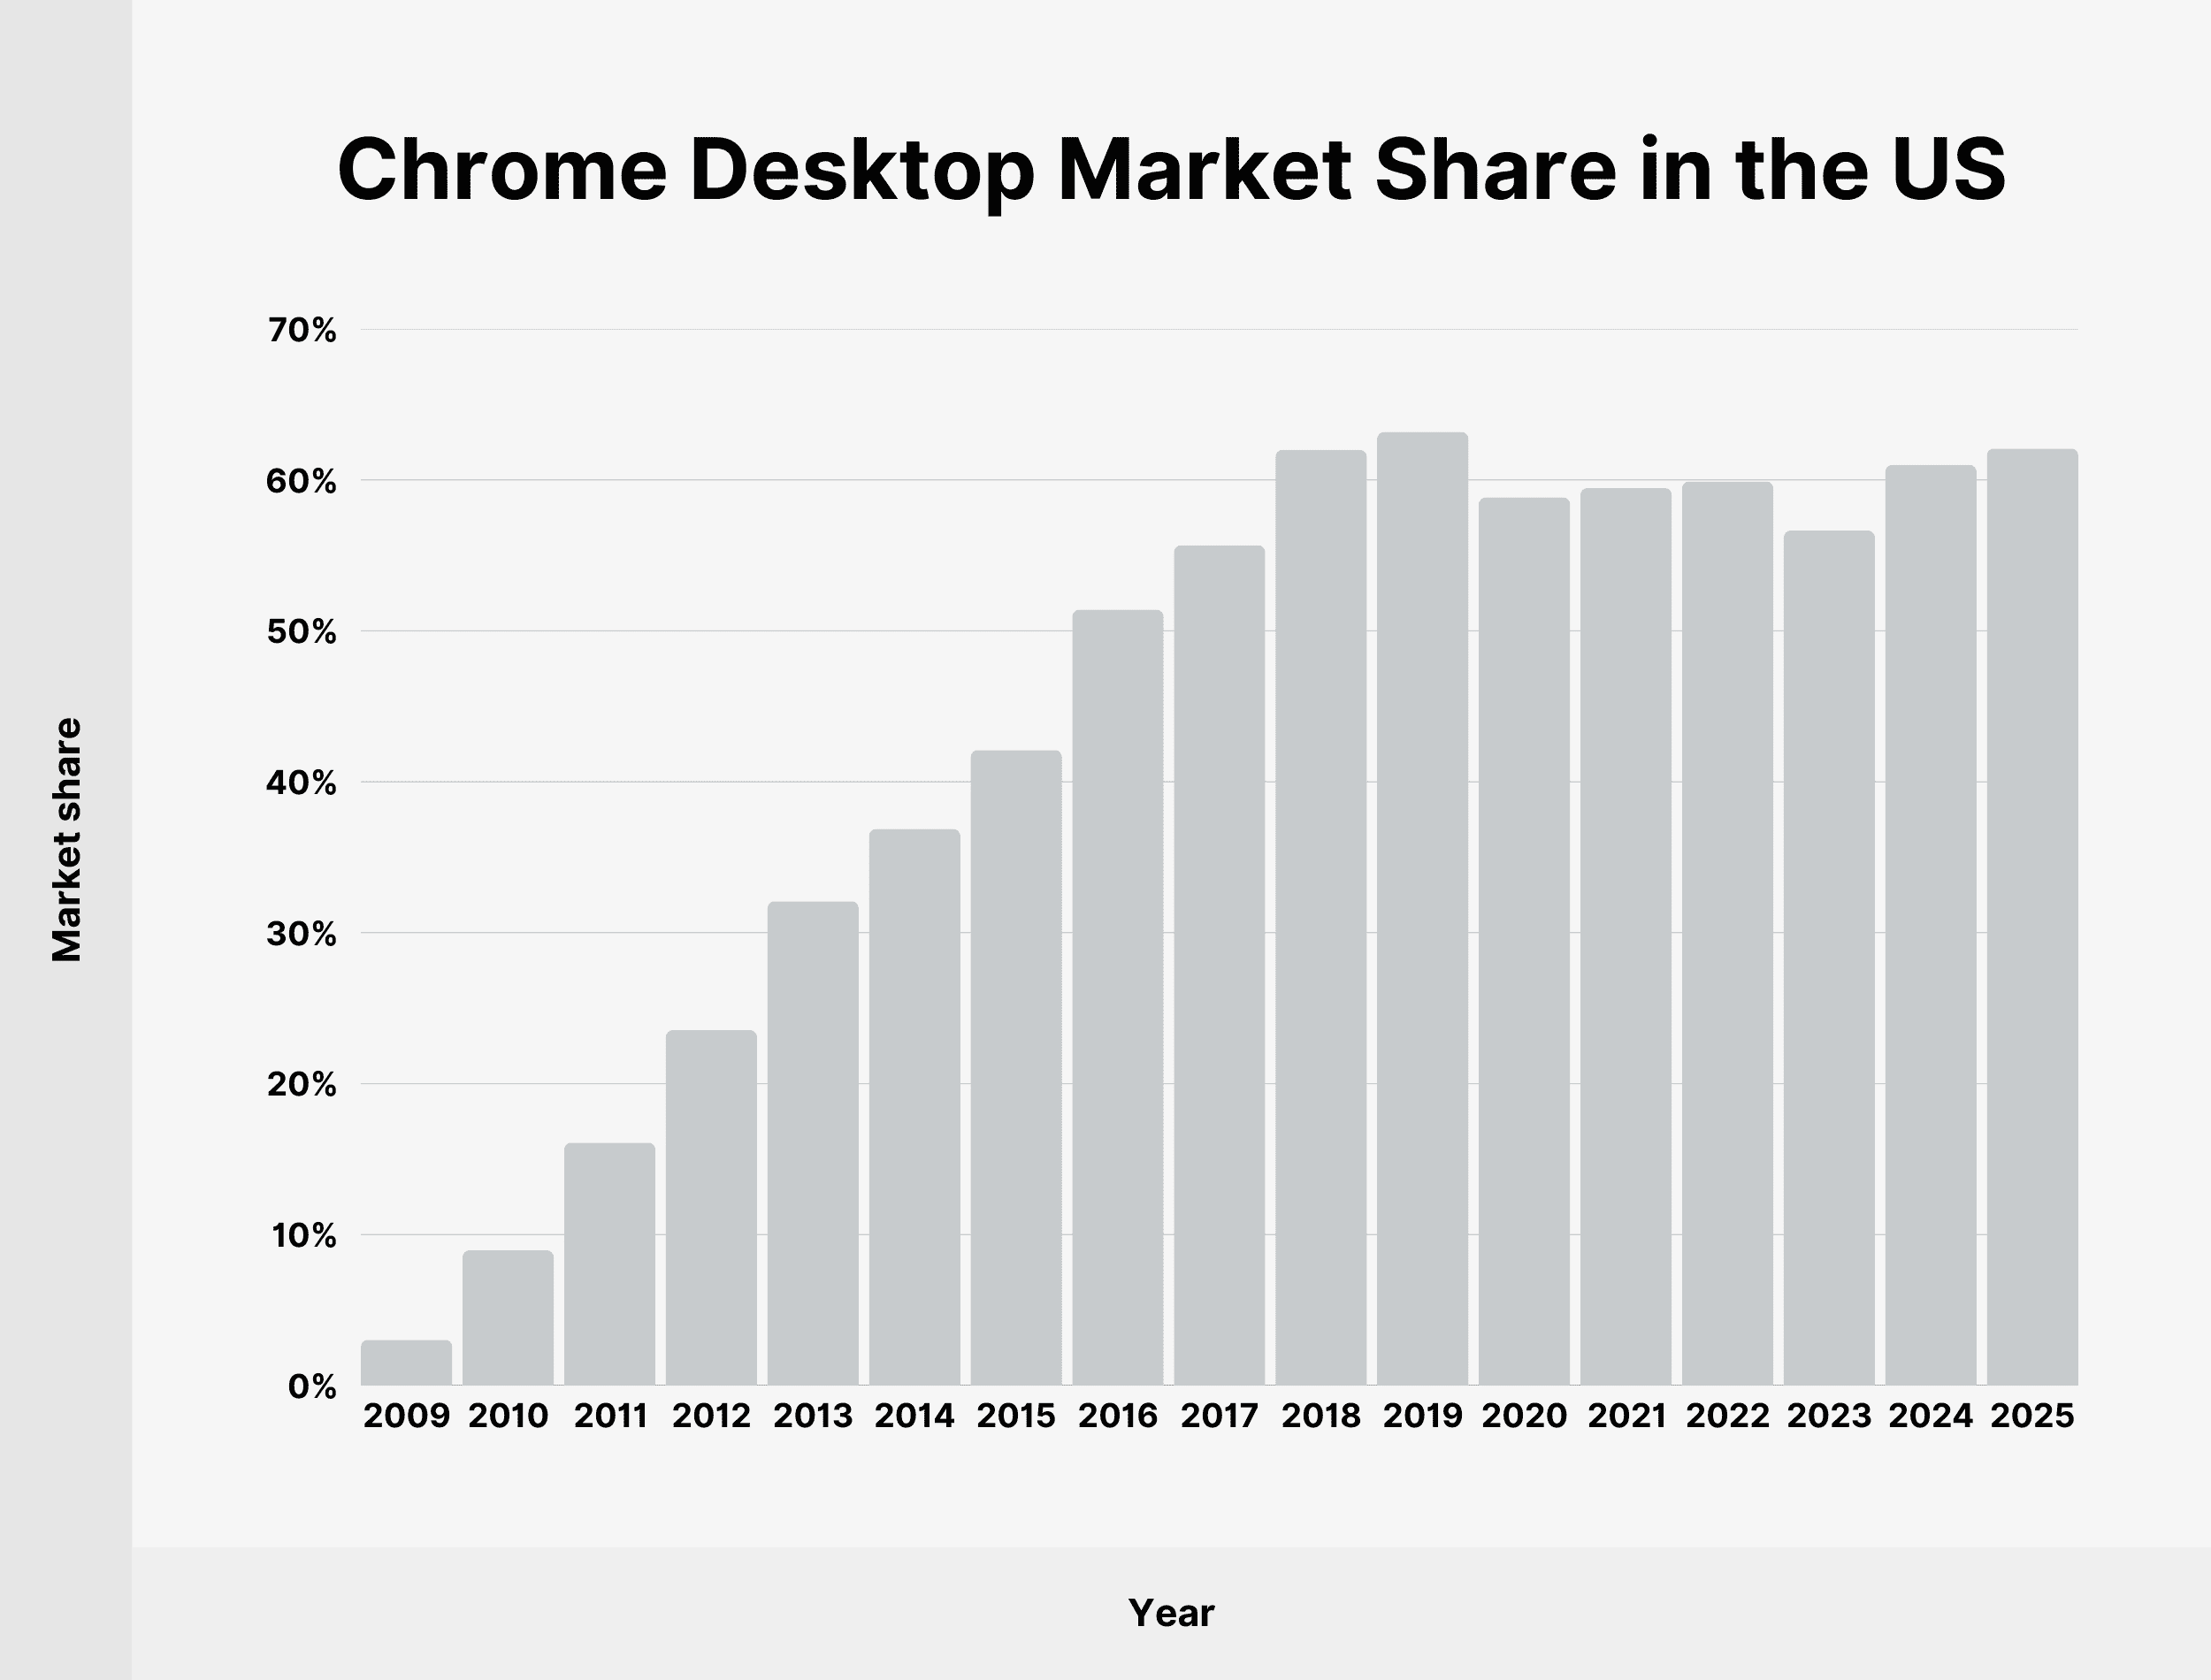
Here’s a table showing Chrome’s desktop browser market share in the US since 2009:
| Year | Market share |
|---|---|
| 2009 | 3.03% |
| 2010 | 8.95% |
| 2011 | 16.09% |
| 2012 | 23.54% |
| 2013 | 32.08% |
| 2014 | 36.87% |
| 2015 | 42.1% |
| 2016 | 51.4% |
| 2017 | 55.66% |
| 2018 | 61.99% |
| 2019 | 63.17% |
| 2020 | 58.84% |
| 2021 | 59.46% |
| 2022 | 59.89% |
| 2023 | 56.64% |
| 2024 | 60.99% |
| 2025 | 62.08% |
Within the mobile category, Chrome has a usage share of 42.49% in the US, making it the second most popular mobile browser in the country.
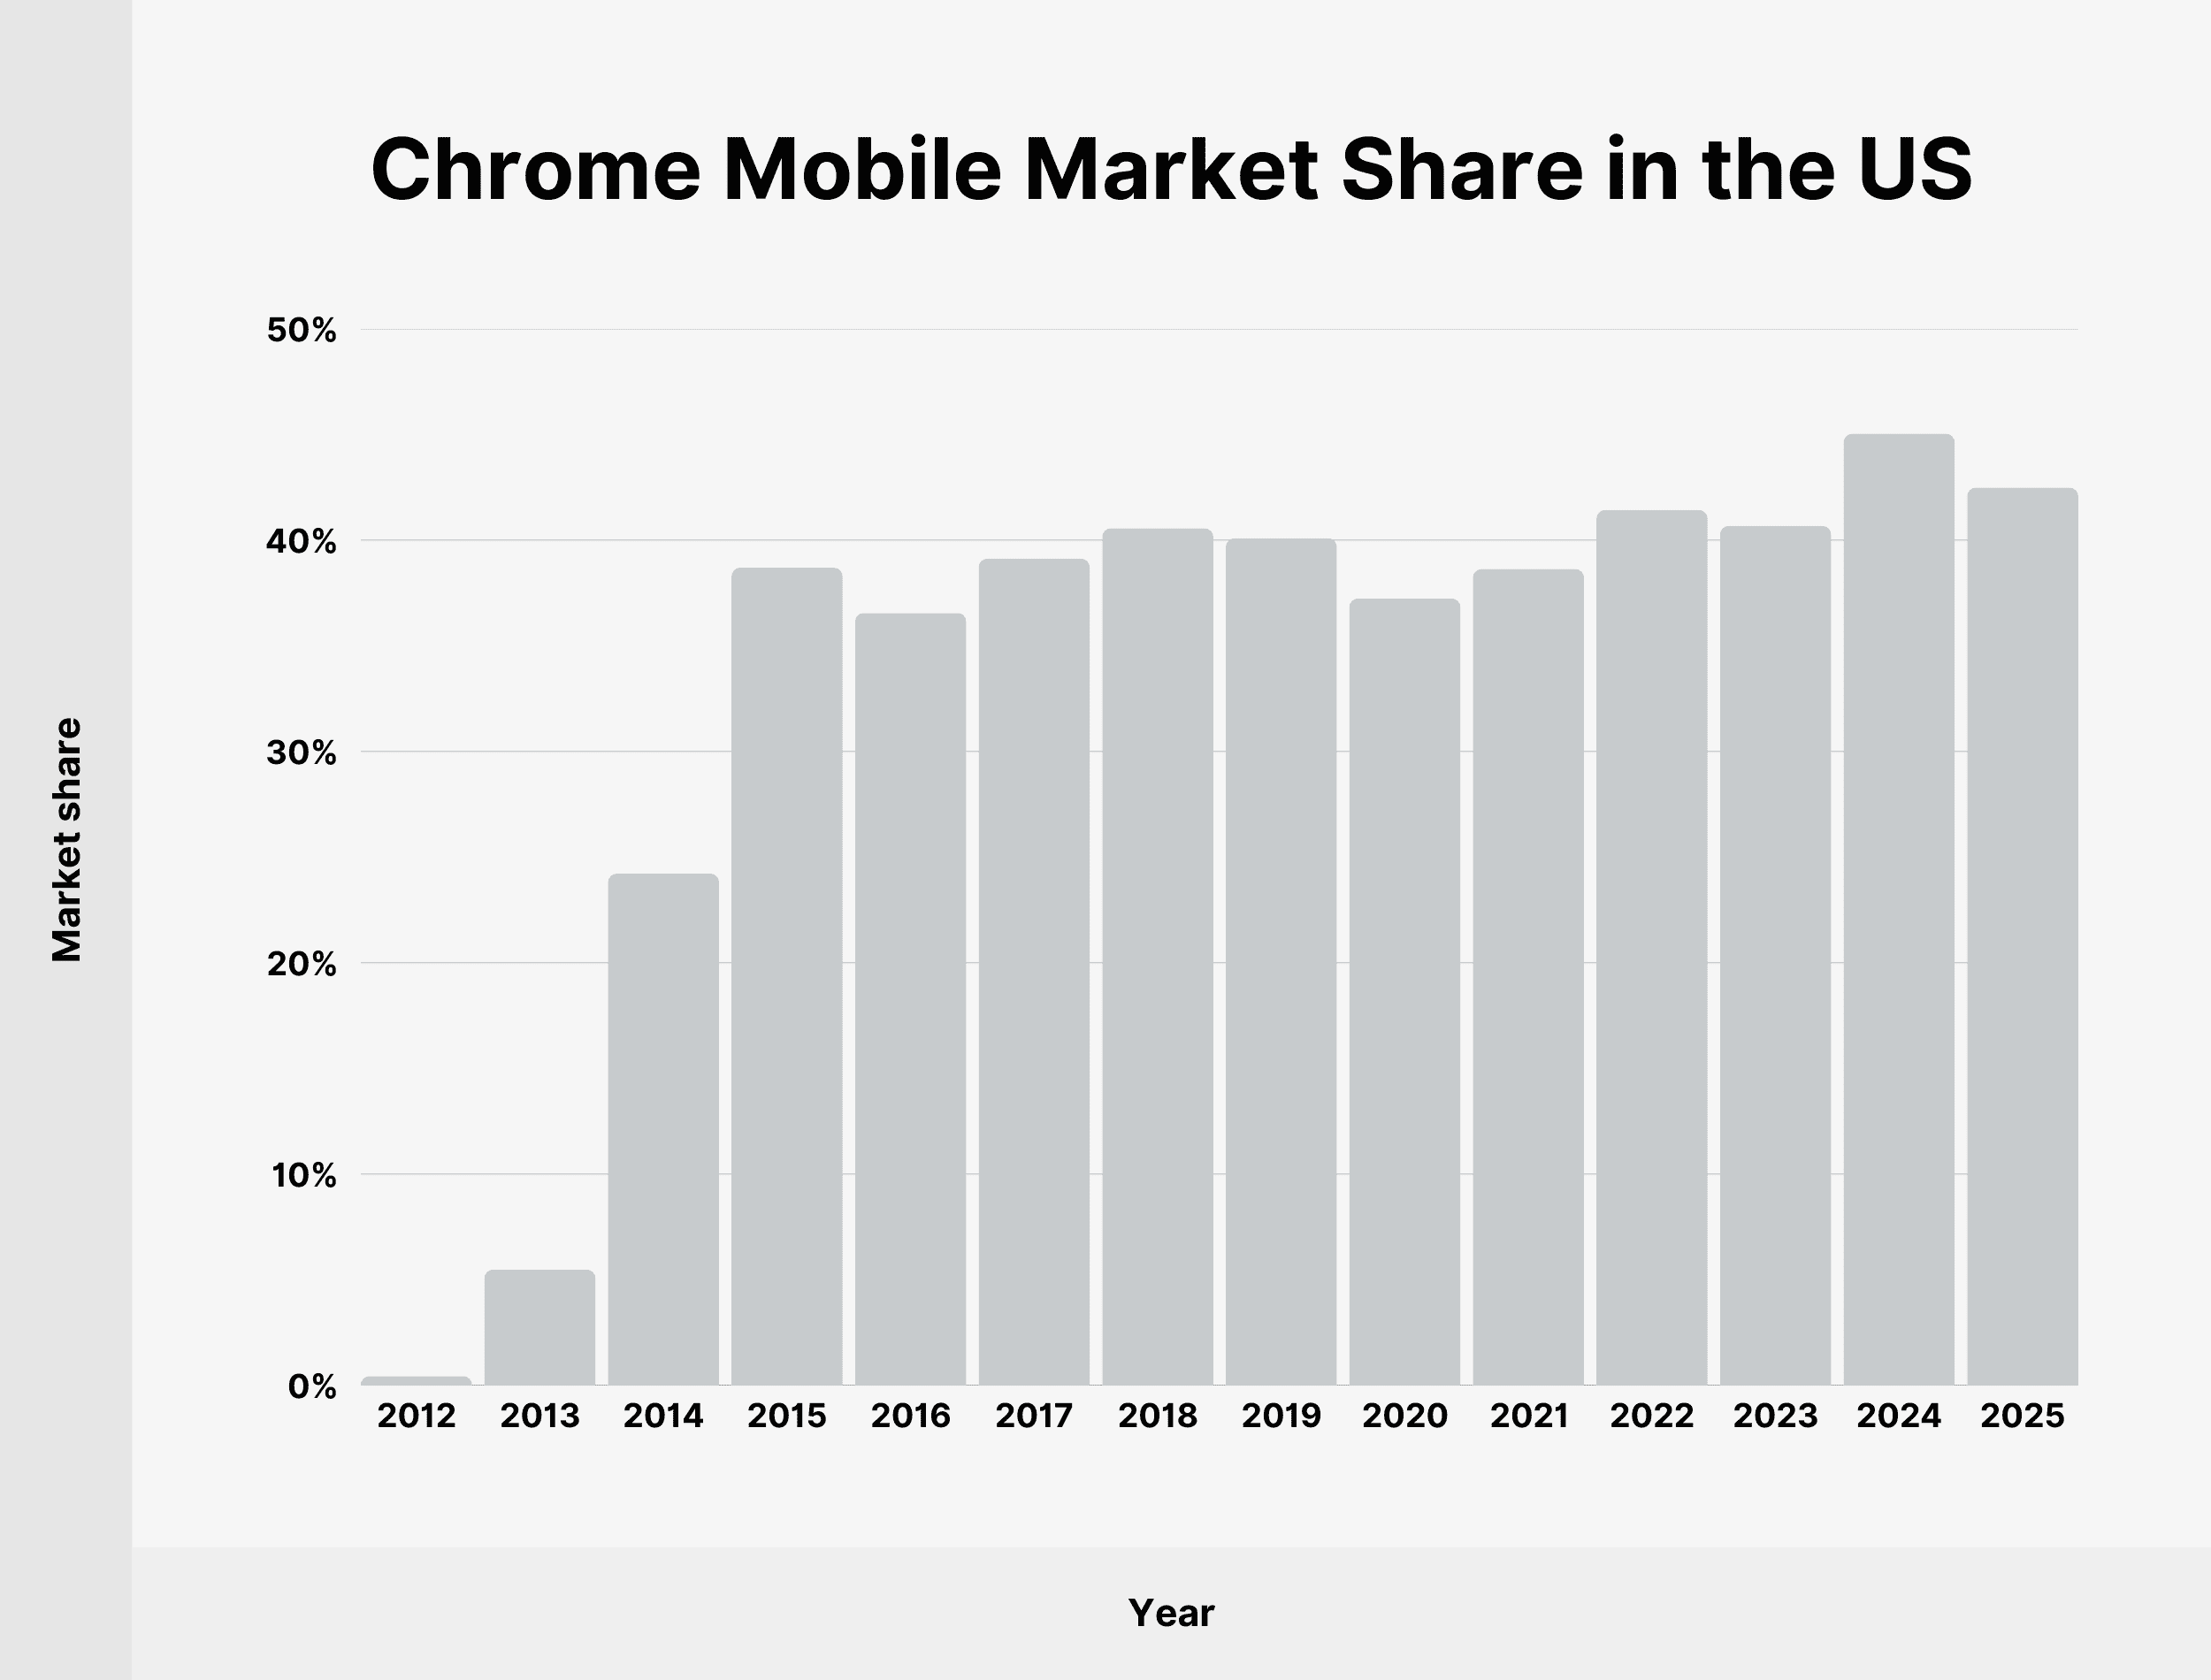
Safari leads the way on mobile, with a market share of 50.18%.
Here’s a breakdown of Chrome’s mobile browser market share in the US since 2012:
| Year | Market share |
|---|---|
| 2012 | 0.44% |
| 2013 | 5.48% |
| 2014 | 24.22% |
| 2015 | 38.7% |
| 2016 | 36.56% |
| 2017 | 39.13% |
| 2018 | 40.56% |
| 2019 | 40.09% |
| 2020 | 37.24% |
| 2021 | 38.64% |
| 2022 | 41.43% |
| 2023 | 40.68% |
| 2024 | 45.04% |
| 2024 | 42.49% |
Source: Statcounter GlobalStats
Number of Chrome Users
An estimated 3.83 billion internet users globally use Chrome as their browser. The user base has grown by 5.8% compared to last year.

In fact, Chrome has added 0.77 billion new users in the last 5 years. As a result, the Chrome user base has grown by an estimated 25.16% since 2020.
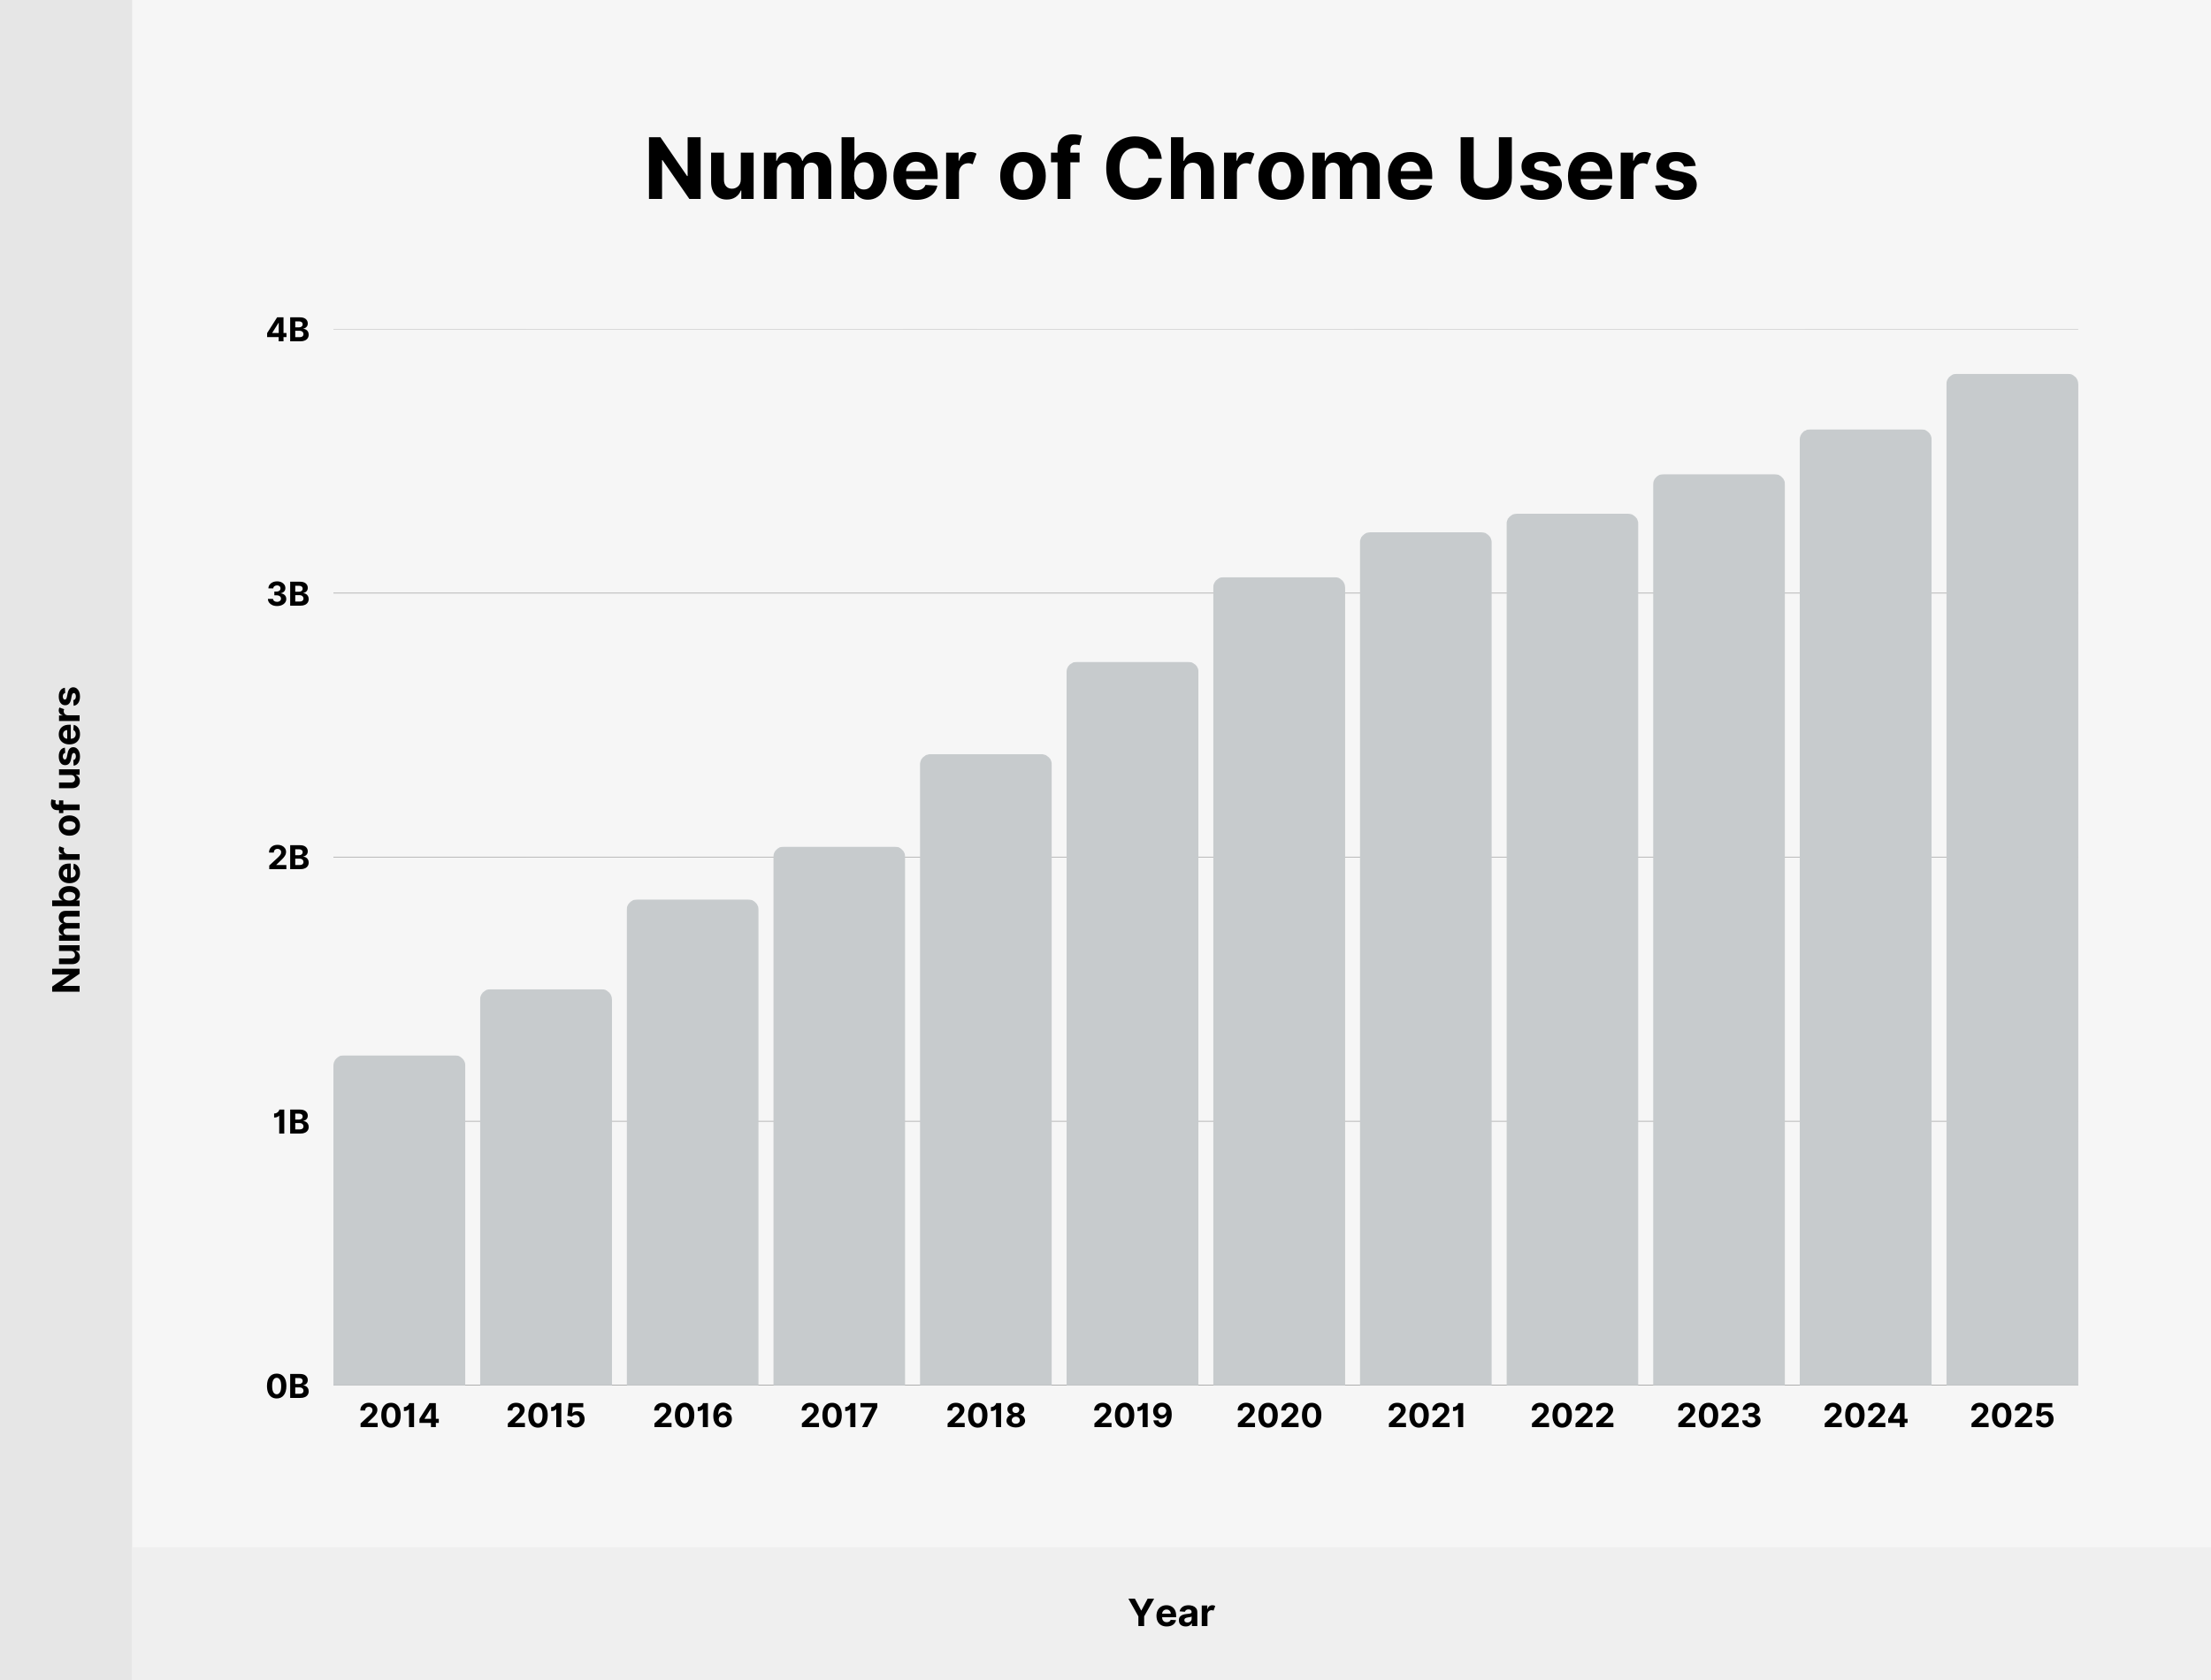
Here’s a table with Chrome user growth since 2014:
| Year | Number of users |
|---|---|
| 2014 | 1.25 billion |
| 2015 | 1.5 billion |
| 2016 | 1.84 billion |
| 2017 | 2.04 billion |
| 2018 | 2.39 billion |
| 2019 | 2.74 billion |
| 2020 | 3.06 billion |
| 2021 | 3.23 billion |
| 2022* | 3.3 billion |
| 2023* | 3.45 billion |
| 2024* | 3.62 billion |
| 2025* | 3.83 billion |
Sources: Statista, ITU, StatCounter
Number of Chrome Extensions
There are 111,933 Chrome extensions (based on data collected in August 2024). That’s down from 137,345 Chrome extensions in May 2020.
Over half (55.5%) of these extensions are used for productivity, while 33.3% are lifestyle.
In total, 95,136 Chrome extensions (85%) have less than 1,000 users.
Only 2,000 (1.8%) have more than 100,000 users.
Here’s a complete breakdown of Chrome extensions by number of users (as of August 2024):
| Number of users | Number of Chrome extensions |
|---|---|
| Less than 100 | 64,526 (57.65% of total) |
| Between 100 and 1,000 | 30,610 (27.35% of total) |
| Between 1,000 and 10,000 | 8,929 (7.98% of total) |
| Between 10,000 and 100,000 | 5,868 (5.24% of total) |
| Between 100,000 and 1 million | 1,758 (1.57% of total) |
| More than 1 million | 242 (0.22% of total) |
Source: DebugBear
Number of Chrome Extensions Developed by Google
There are 16 Chrome extensions developed by Google available for download as of September 2025.
A total of 8 extensions developed by Google have more than 1 million users.
Source: Chrome Web Store
Chrome App Downloads
The Google Chrome mobile app was downloaded 83.89 million times across iOS & Android platforms as of September 2025.

Google Chrome has more than 10 billion lifetime downloads on Google Play, a milestone it passed in December 2021.
Sources: Statista, Android Rank
Conclusion
You made it! That’s it for my Google Chrome stats roundup. Hopefully, you’ve learned something new about Chrome from these facts and figures.
The browser has an incredible growth story and continues to be the top player in the market. It will be interesting to see whether it can sustain its position of dominance in the years to come.
Backlinko is owned by Semrush. We’re still obsessed with bringing you world-class SEO insights, backed by hands-on experience. Unless otherwise noted, this content was written by either an employee or paid contractor of Semrush Inc.
