Tesla was incorporated as an electric vehicle manufacturer in July 2003.
Initially, the company faced significant difficulties when it came to developing technology, producing prototypes, and scaling manufacturing. Elon Musk joined the company as chairman in 2004. Early on, he stated that Tesla had just a 10% chance of success.
Today, Tesla delivers more than 400,000 vehicles each quarter.
Key Tesla Stats
- Tesla sold 1,789,226 electric cars in 2024, ranking 2nd worldwide after BYD.
- Tesla sold over 7.95 million vehicles to date.
- Tesla’s revenue was $97.69 billion in 2024.
- 125,665 employees work at Tesla worldwide.
Tesla Vehicle Deliveries
In 2024, Tesla delivered 1,789,226 vehicles.
Tesla’s quarterly deliveries in Q2 2025 hit 384,000, representing a 14.29% year-over-year increase.

Here’s a comprehensive overview of Tesla deliveries since 2013:
| Year | Deliveries |
|---|---|
| 2013 | 22,442 |
| 2014 | 31,655 |
| 2015 | 50,517 |
| 2016 | 76,243 |
| 2017 | 103,091 |
| 2018 | 245,491 |
| 2019 | 367,656 |
| 2020 | 499,535 |
| 2021 | 936,222 |
| 2022 | 1,313,851 |
| 2023 | 1,808,581 |
| 2024 | 1,789,226 |
Sources: Tesla, CleanTechnica
Tesla Vehicle Production
Tesla produced 1,773,443 vehicles in 2024, showing a 3.93% year-over-year decrease.

Here’s a complete breakdown of Tesla vehicle production since 2014:
| Year | Production |
|---|---|
| 2014 | 35,000 |
| 2015 | 51,095 |
| 2016 | 83,922 |
| 2017 | 100,757 |
| 2018 | 254,530 |
| 2019 | 365,232 |
| 2020 | 509,737 |
| 2021 | 930,422 |
| 2022 | 1,369,611 |
| 2023 | 1,845,985 |
| 2024 | 1,773,443 |
Source: Tesla
Total Teslas Sold
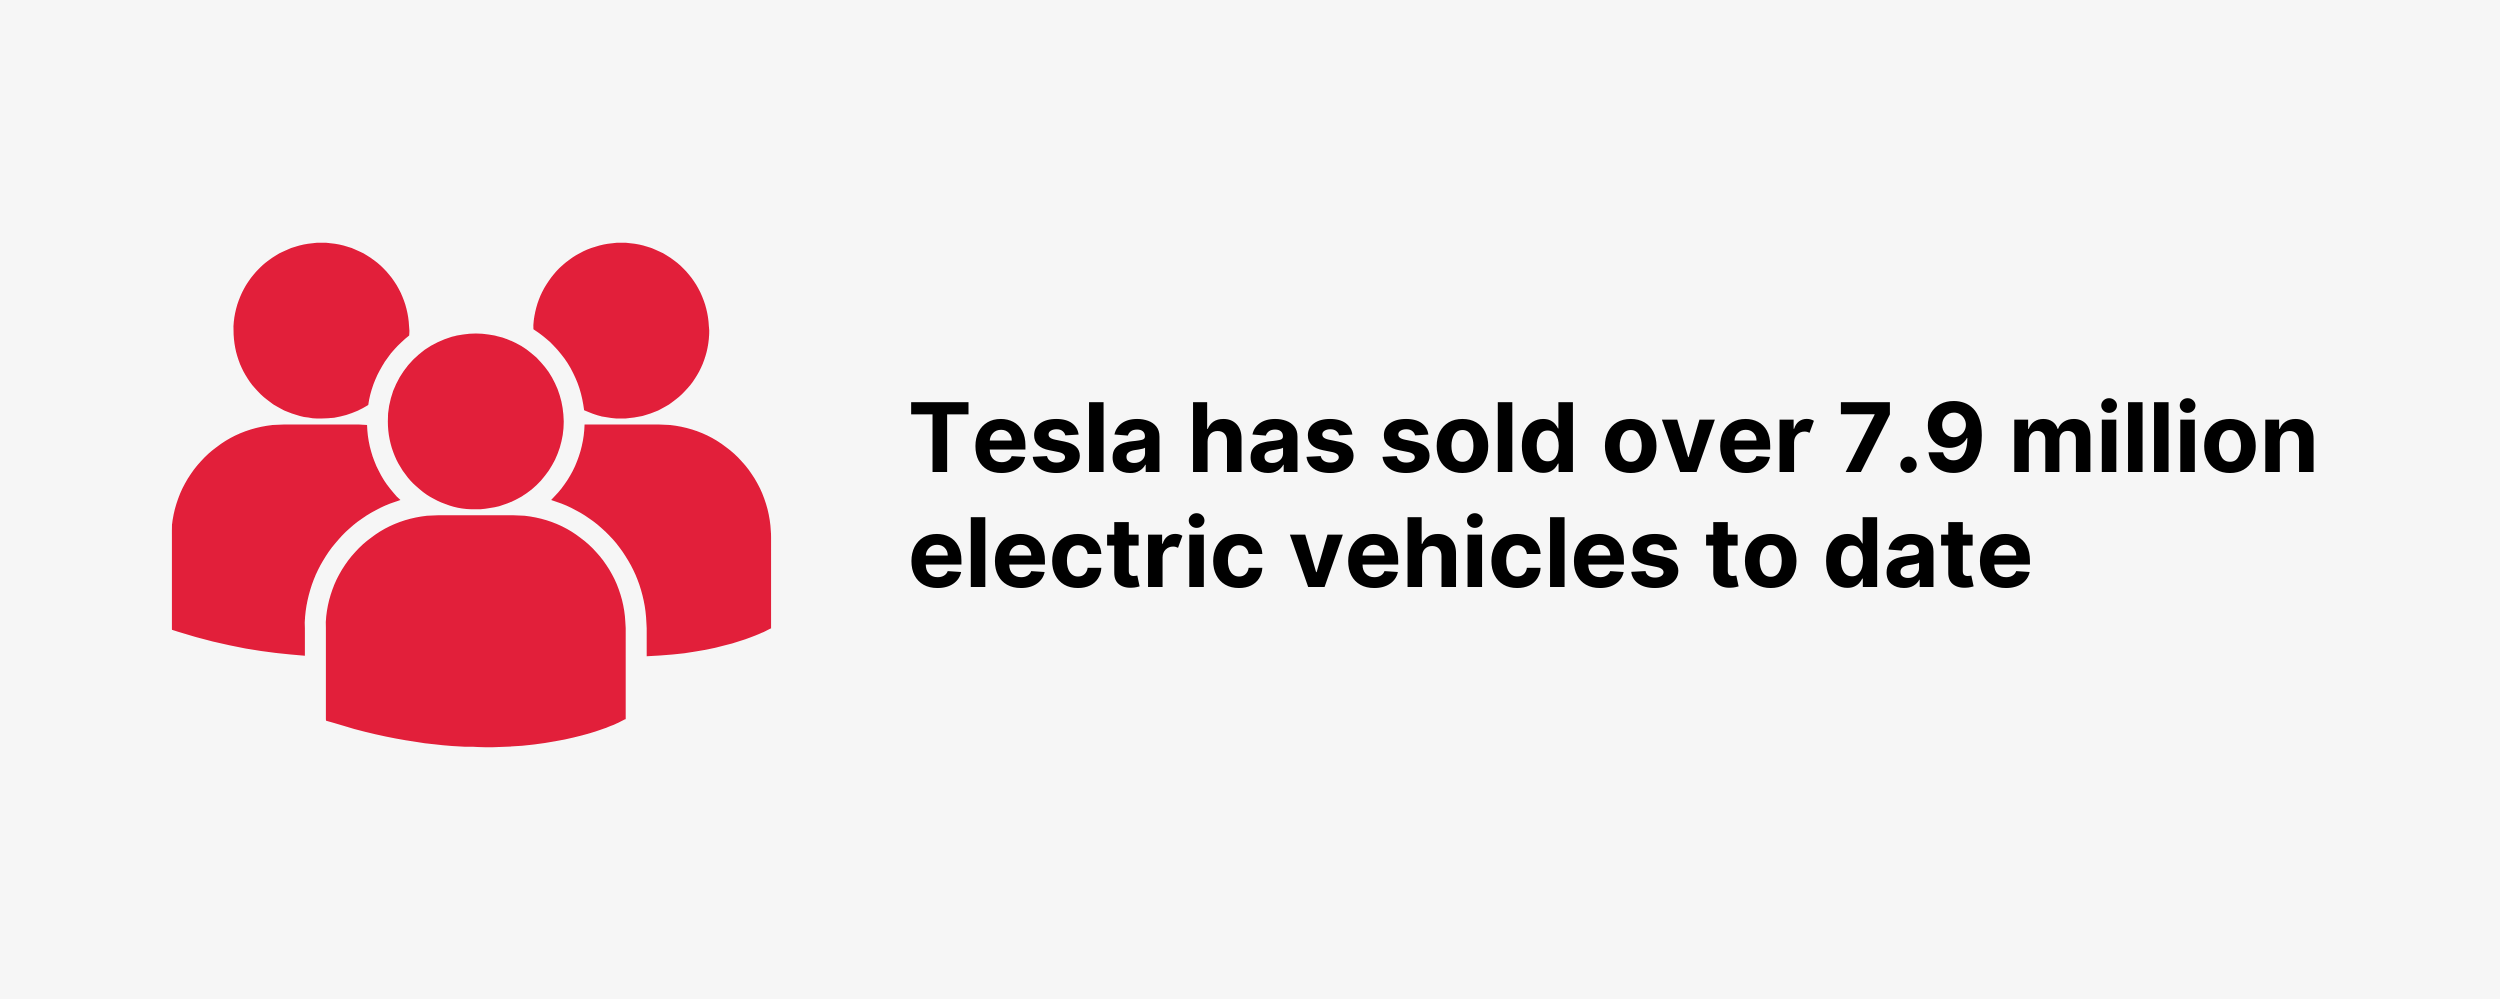
According to Tesla investor reports, Tesla has sold over 7.9 million electric vehicles to date.

Tesla Annual Revenue
In 2024, Tesla generated $97.69 billion in annual revenue. That’s an increase of 0.95% compared to 2023.

We’ve charted the growth in Tesla’s annual revenue since 2008:
| Year | Annual revenue |
|---|---|
| 2008 | $15 million |
| 2009 | $112 million |
| 2010 | $117 million |
| 2011 | $204 million |
| 2012 | $413 million |
| 2013 | $2.01 billion |
| 2014 | $3.2 billion |
| 2015 | $4.05 billion |
| 2016 | $7 billion |
| 2017 | $11.76 billion |
| 2018 | $21.46 billion |
| 2019 | $24.58 billion |
| 2020 | $31.54 billion |
| 2021 | $53.82 billion |
| 2022 | $81.46 billion |
| 2023 | $96.77 billion |
| 2024 | $97.69 billion |
Sources: Tesla, Macrotrends
Tesla Supercharger Locations
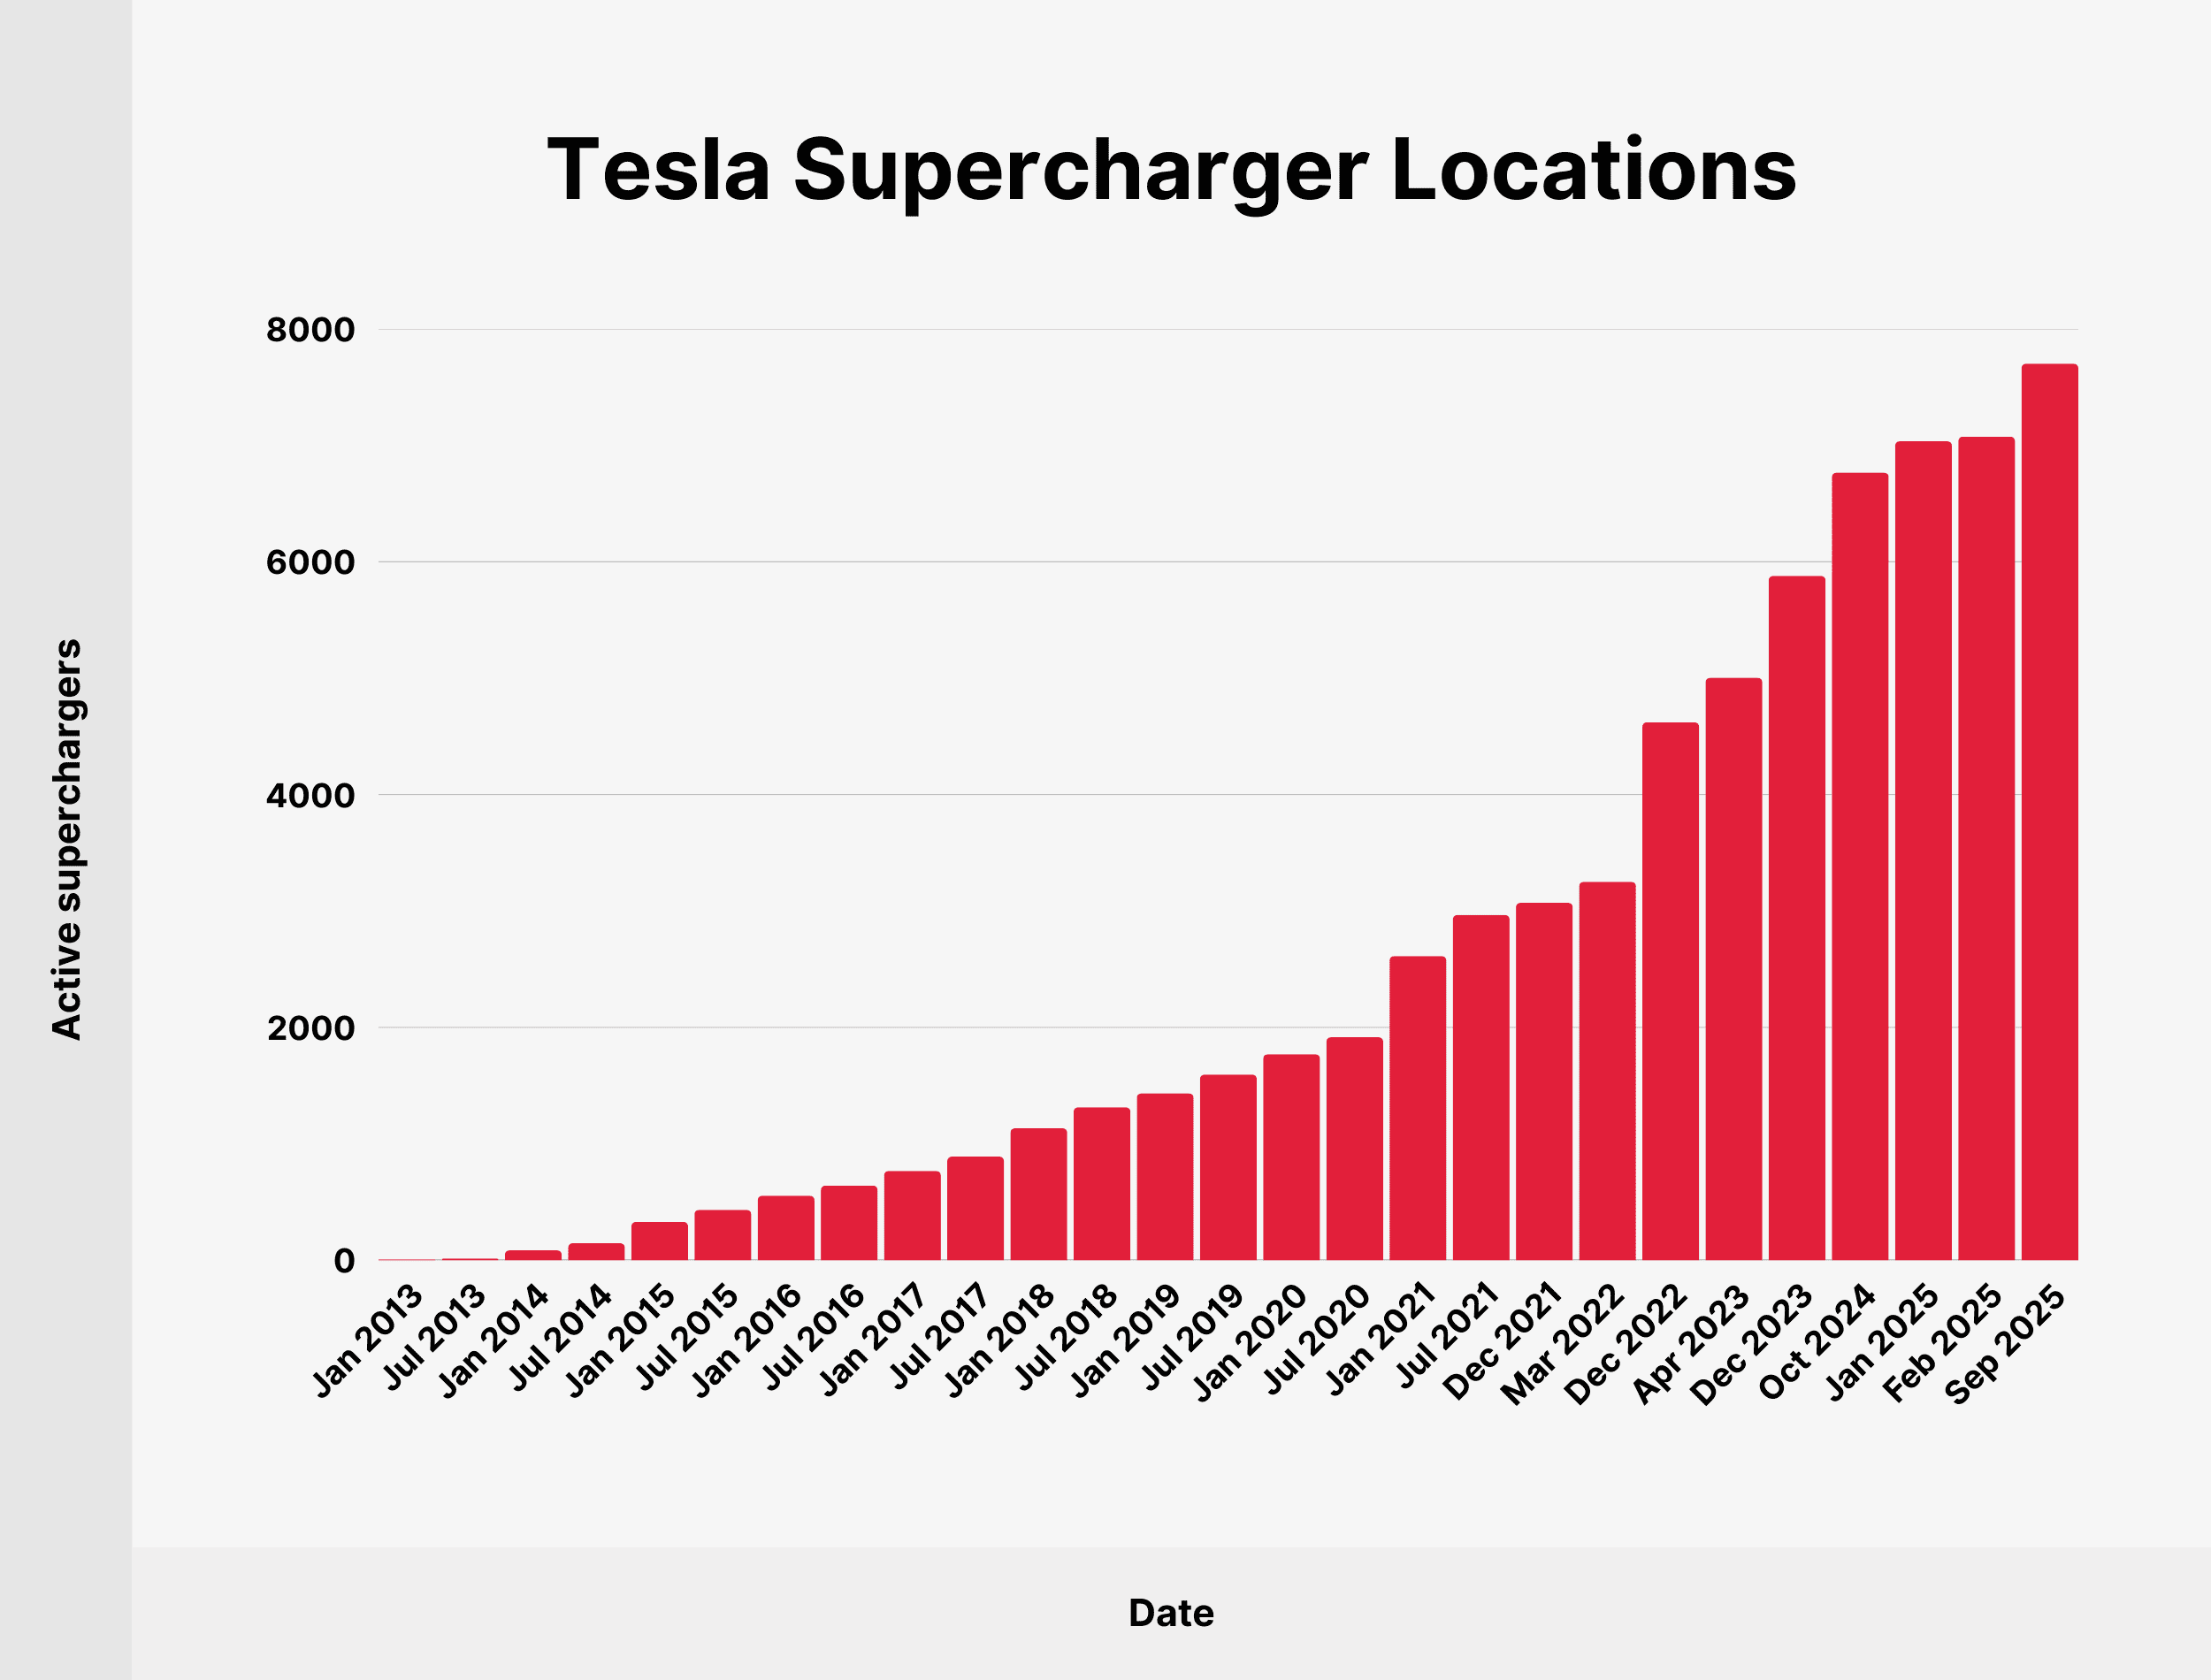
Supercharger is Tesla’s fast-charging network. Tesla operates 7,702 Supercharger stations in 55 countries as of September 2025.

The number of Supercharger locations has increased by 31% in less than the past two years (December 2023 – September 2025).
In the last 3 years alone (December 2022 – September 2025), Tesla has added 3,082 new Supercharger stations.
Here’s a table showing the number of active Supercharger stations since 2013:
| Date | Active superchargers |
|---|---|
| January 2013 | 7 |
| July 2013 | 15 |
| January 2014 | 84 |
| July 2014 | 145 |
| January 2015 | 328 |
| July 2015 | 432 |
| January 2016 | 553 |
| July 2016 | 640 |
| January 2017 | 767 |
| July 2017 | 889 |
| January 2018 | 1133 |
| July 2018 | 1314 |
| January 2019 | 1433 |
| July 2019 | 1594 |
| January 2020 | 1770 |
| July 2020 | 1915 |
| January 2021 | 2613 |
| July 2021 | 2966 |
| December 2021 | 3070 |
| March 2022 | 3251 |
| December 2022 | 4620 |
| April 2023 | 5003 |
| December 2023 | 5878 |
| October 2024 | 6766 |
| January 2025 | 7035 |
| February 2025 | 7074 |
| September 2025 | 7702 |
Source: supercharge.info
Tesla Supercharger Stations by Country
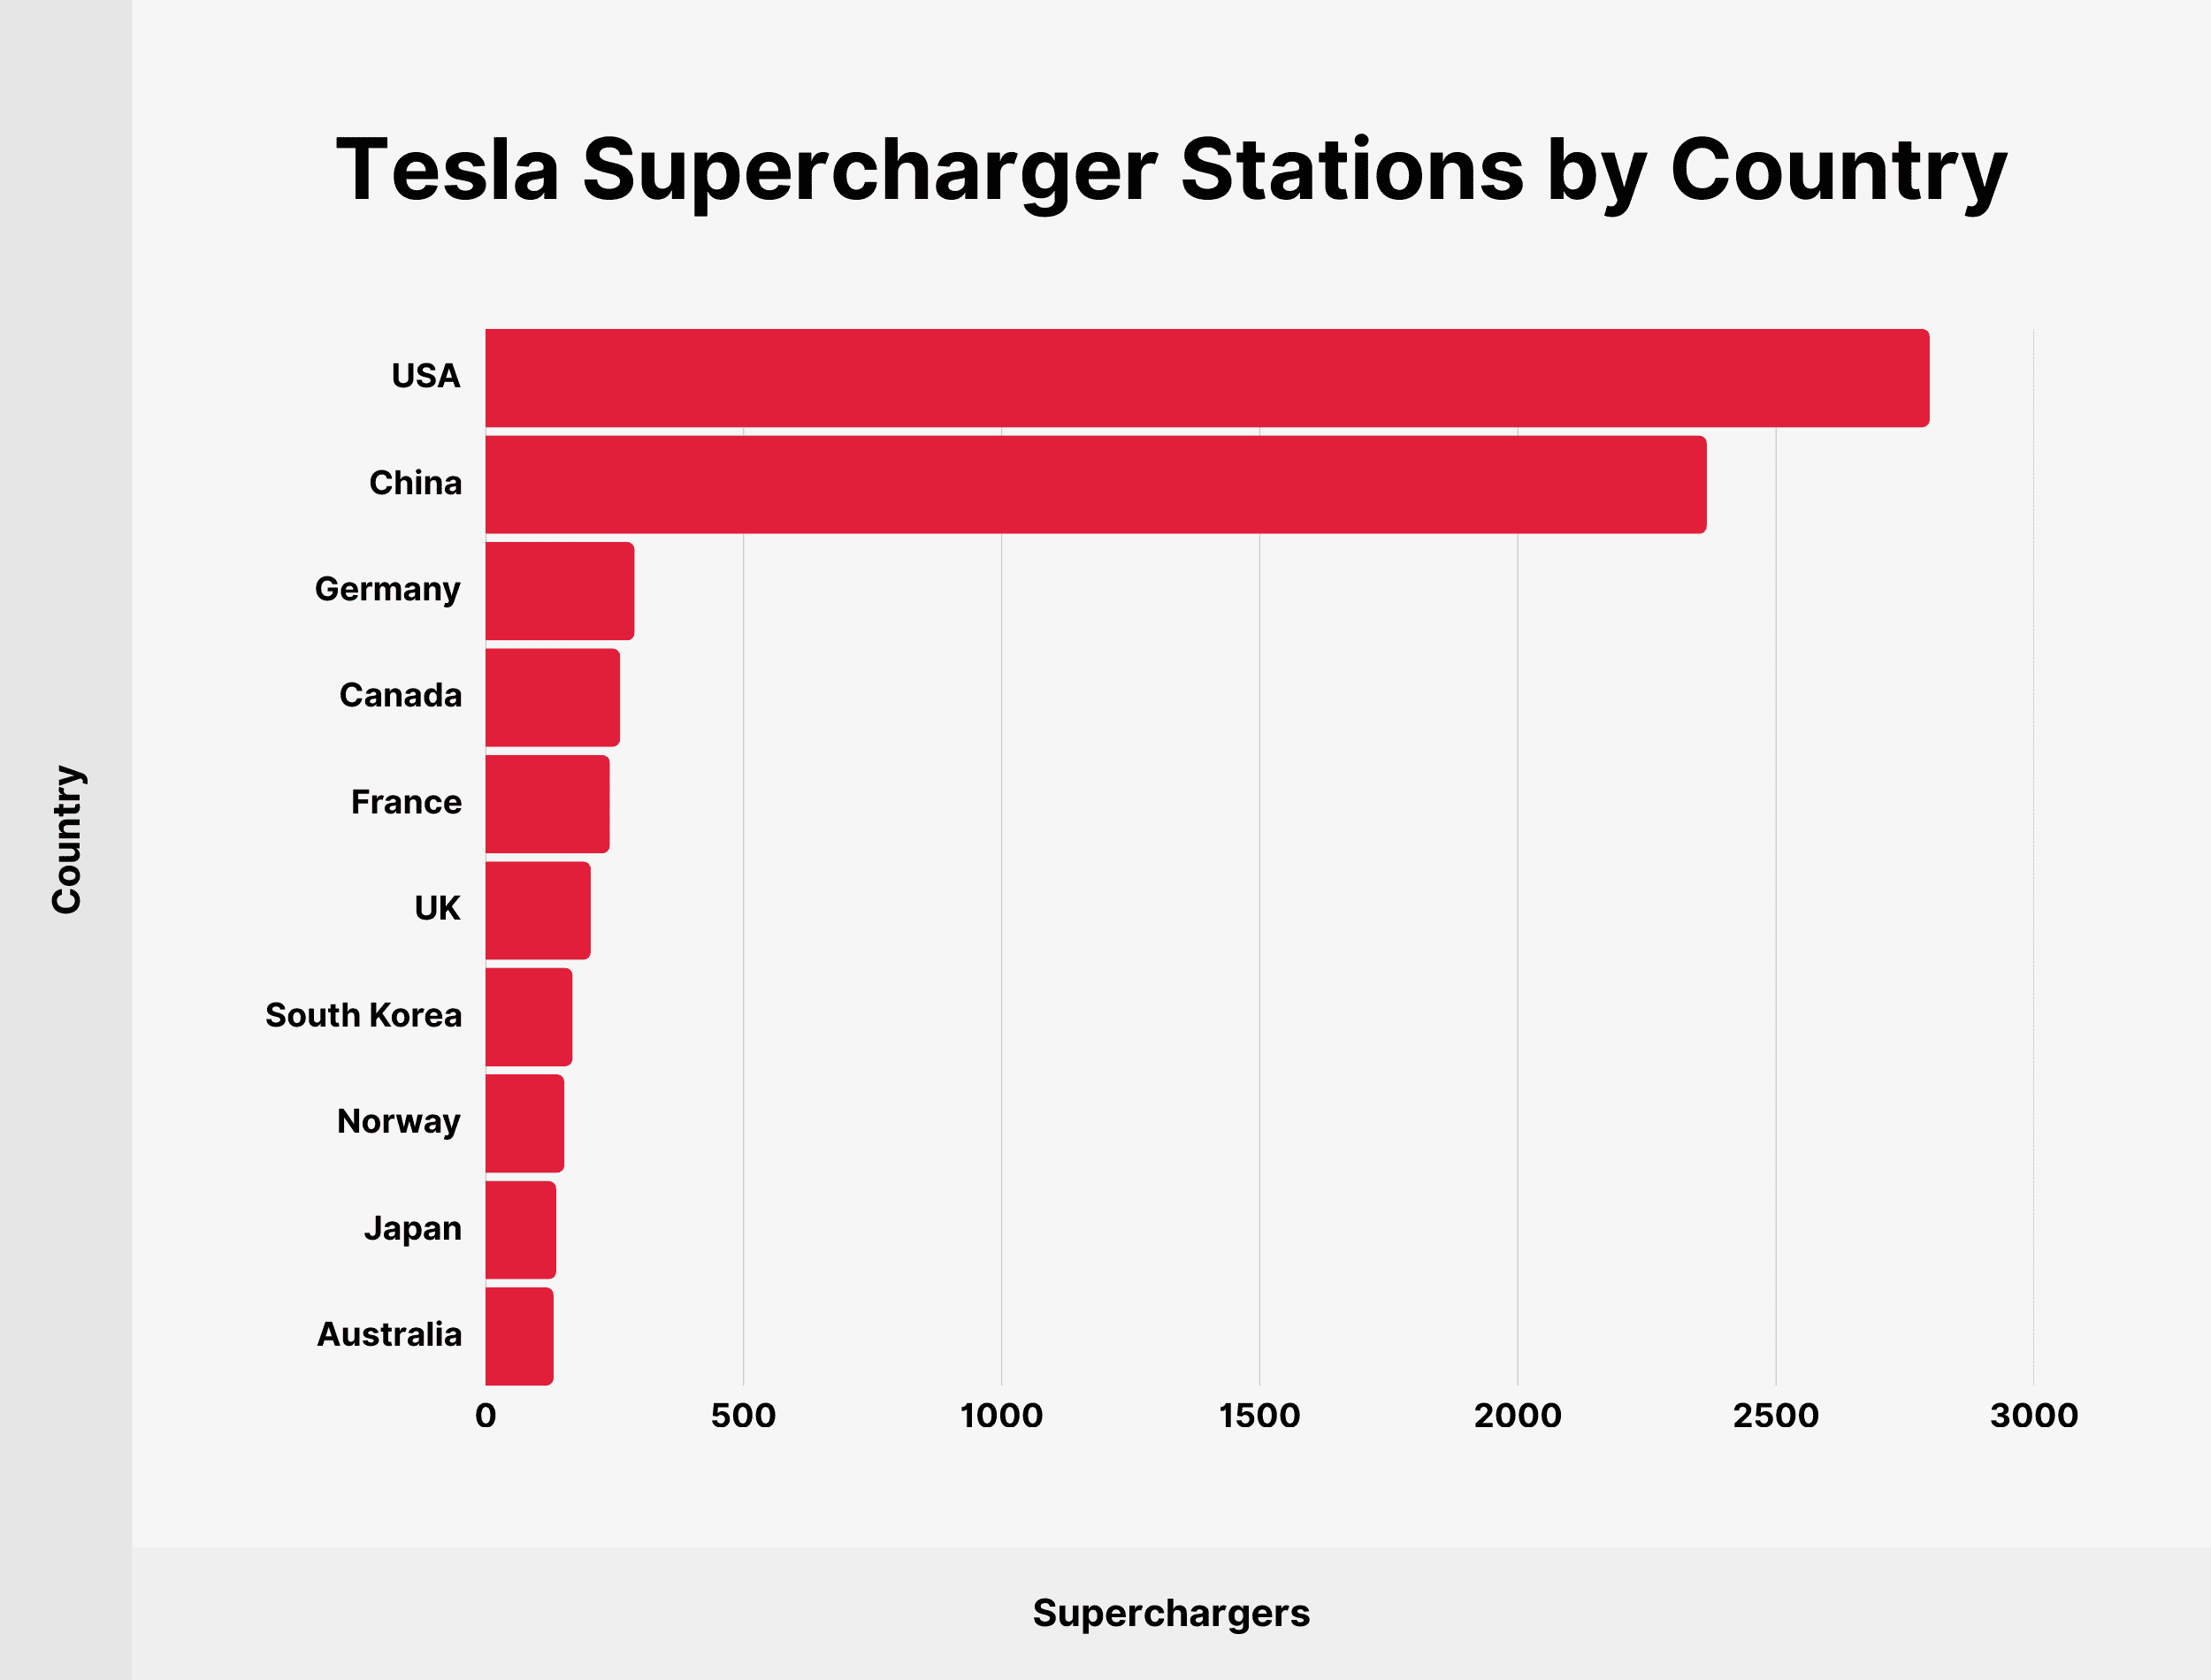
As of September 2025, the US and China account for 67% of all Tesla Supercharger stations. The two countries combined have 5,064 Supercharger locations open.

While the Tesla Supercharger network extends to around 40 countries, the vast majority (87.6%) of stations are located in just 10 countries.
With that, here’s a table that contains the full data:
| Country | Superchargers (% Share of Total) |
|---|---|
| USA | 2798 (36.3%) |
| China | 2366 (30.7%) |
| Germany | 289 (3.8%) |
| Canada | 261 (3.4%) |
| France | 241 (3.1%) |
| UK | 204 (1.6%) |
| South Korea | 169 (2.2%) |
| Norway | 153 (2%) |
| Japan | 137 (1.8%) |
| Australia | 132 (1.7%) |
Source: supercharge.info
Tesla Manufacturing Facilities
Tesla has 4 active automotive manufacturing facilities spanning 3 countries: the United States, China, and Germany.
As well as the original Fremont Factory in California, there are active production lines at the Gigafactory Texas, Gigafactory Berlin-Brandenburg, and Gigafactory Shanghai.
Source: Tesla
Tesla Worldwide Sales
Tesla sold 101,101 vehicles in January 2025, making it the 2nd most popular EV manufacturer after BYD.
To put it in perspective, Tesla reached 113,978 vehicle registrations in January 2024.

Here’s a list of the top 10 electric car manufacturers in January 2025:
| Car manufacturer | EV Sales |
|---|---|
| BYD | 278,589 |
| Tesla | 101,101 |
| Geely | 92,936 |
| Wuling | 46,839 |
| Volkswagen | 42,970 |
| BMW | 39,724 |
| Xpeng | 30,350 |
| Li Auto | 29,927 |
| Toyota | 25,266 |
| Leap Motor | 25,170 |
Source: CleanTechnica, CleanTechnica
Tesla Sales in the US
The Tesla Model Y was the most popular electric vehicle in the US, ranked by the number of vehicle sales in 2024. In total, 372,613 Model Y vehicles were sold, showing a 6.6% year-over-year decrease.
Tesla Model 3 claims second place with 189,903 annual sales in the country, with an annual decrease of 17.4%.

Here are the most popular electric vehicles in the US, ranked by the number of sales in 2024:
| EV Model | Sales |
|---|---|
| Tesla Model Y | 372,613 |
| Tesla Model 3 | 189,903 |
| Ford Mustang Mach-E | 51,745 |
| Hyundai Ioniq 5 | 44,400 |
| Tesla Cybertruck | 38,965 |
| Ford F-150 Lightning | 33,510 |
| Honda Prologue | 33,017 |
| Chevrolet Equinox | 28,874 |
| Cadillac Lyriq | 28,402 |
| RIvian R1S | 26,934 |
Source: Cox Automotive
Tesla Sales in China
In January 2025, the Tesla Model Y was the third most-sold electric vehicle in China. A total of 25,694 Model Ys have been sold.

Here’s a ranking of the top 10 most popular electric vehicles in China in January 2025:
| EV Model | Sales |
|---|---|
| BYD Song (BEV+PHEV) | 35,836 |
| Geely Geome Xingyuan | 28,146 |
| Tesla Model Y | 25,694 |
| Wuling HongGuang Mini EV | 24,924 |
| Xiaomi SU7 | 22,897 |
| Geely Galaxy Starship 7 | 20,328 |
| BYD Qin Plus (BEV+PHEV) | 19,735 |
| BYD Seagull | 18,171 |
| BYD Qin L | 16,047 |
| Geely Panda Mini | 15,932 |
Source: CleanTechnica
Tesla Sales in Europe
In January 2025, the Tesla Model Y was the 3rd most-sold electric vehicle in Europe, after the VW ID.4 and the Skoda Enyaq. 5,890 vehicles have been sold across the continent.

Here’s a ranking of the top 10 most sold electric vehicles in Europe in January 2025:
| EV Model | Sales |
|---|---|
| VW ID.4 | 7,040 |
| Skoda Enyaq | 6,695 |
| Tesla Model Y | 5,890 |
| VW ID.7 | 5,852 |
| KIA EV3 | 5,633 |
| VW ID.3 | 5,436 |
| Dacia Spring | 5,109 |
| Volvo XC60 PHEV | 4,731 |
| Renault 5 | 4,507 |
| Audi Q4 e-Tron | 4,497 |
Source: CleanTechnica
How Many People Work at Tesla?
According to the latest company update, Tesla has 125,665 employees.

Here’s a table showing the Tesla employee count since 2010:
| Year | Employees |
|---|---|
| 2010 | 899 |
| 2011 | 1,417 |
| 2012 | 2,964 |
| 2013 | 5,859 |
| 2014 | 10,161 |
| 2015 | 13,058 |
| 2016 | 17,782 |
| 2017 | 37,543 |
| 2018 | 48,817 |
| 2019 | 48,016 |
| 2020 | 70,757 |
| 2021 | 99,290 |
| 2022 | 127,855 |
| 2023 | 140,473 |
| 2024 | 125,665 |
The median compensation package for software engineers at Tesla totals $198,000. Tesla employees working in the US on an H1-B visa receive a median base salary of $145,805.
Sources: Macrotrends, Levels.fyi, H1B Salary Database
Conclusion
That’s it for our list of Tesla statistics. Hopefully, the facts and figures included here have helped shed some light on Tesla’s growth story.
It will be interesting to see if the company will overcome its current challenges and return to an upward trajectory.
Backlinko is owned by Semrush. We’re still obsessed with bringing you world-class SEO insights, backed by hands-on experience. Unless otherwise noted, this content was written by either an employee or paid contractor of Semrush Inc.

