68 Super Interesting Social Media Marketing Stats
This is a list of UPDATED social media marketing statistics.
On this list of stats, you’ll find up-to-date data on:
- Facebook use and engagement
- Social media advertising
- Instagram engagement
- Snapchat marketing
- And more
So if you’re looking for new and updated social media stats, you’ve come to the
right place.
01.Facebook Statistics
Facebook may not be growing like it used to. But it’s still the biggest social media platform on the planet (by a mile). So it’s no wonder that a majority of businesses say that Facebook is their #1 social media marketing channel. That said, how relevant is Facebook marketing in 2026? Let’s see what the data says…
- Facebook has 3.07 billion active monthly users (Statista)
- Facebook adult users spend an average of 20 minutes daily on the platform (eMarketer)
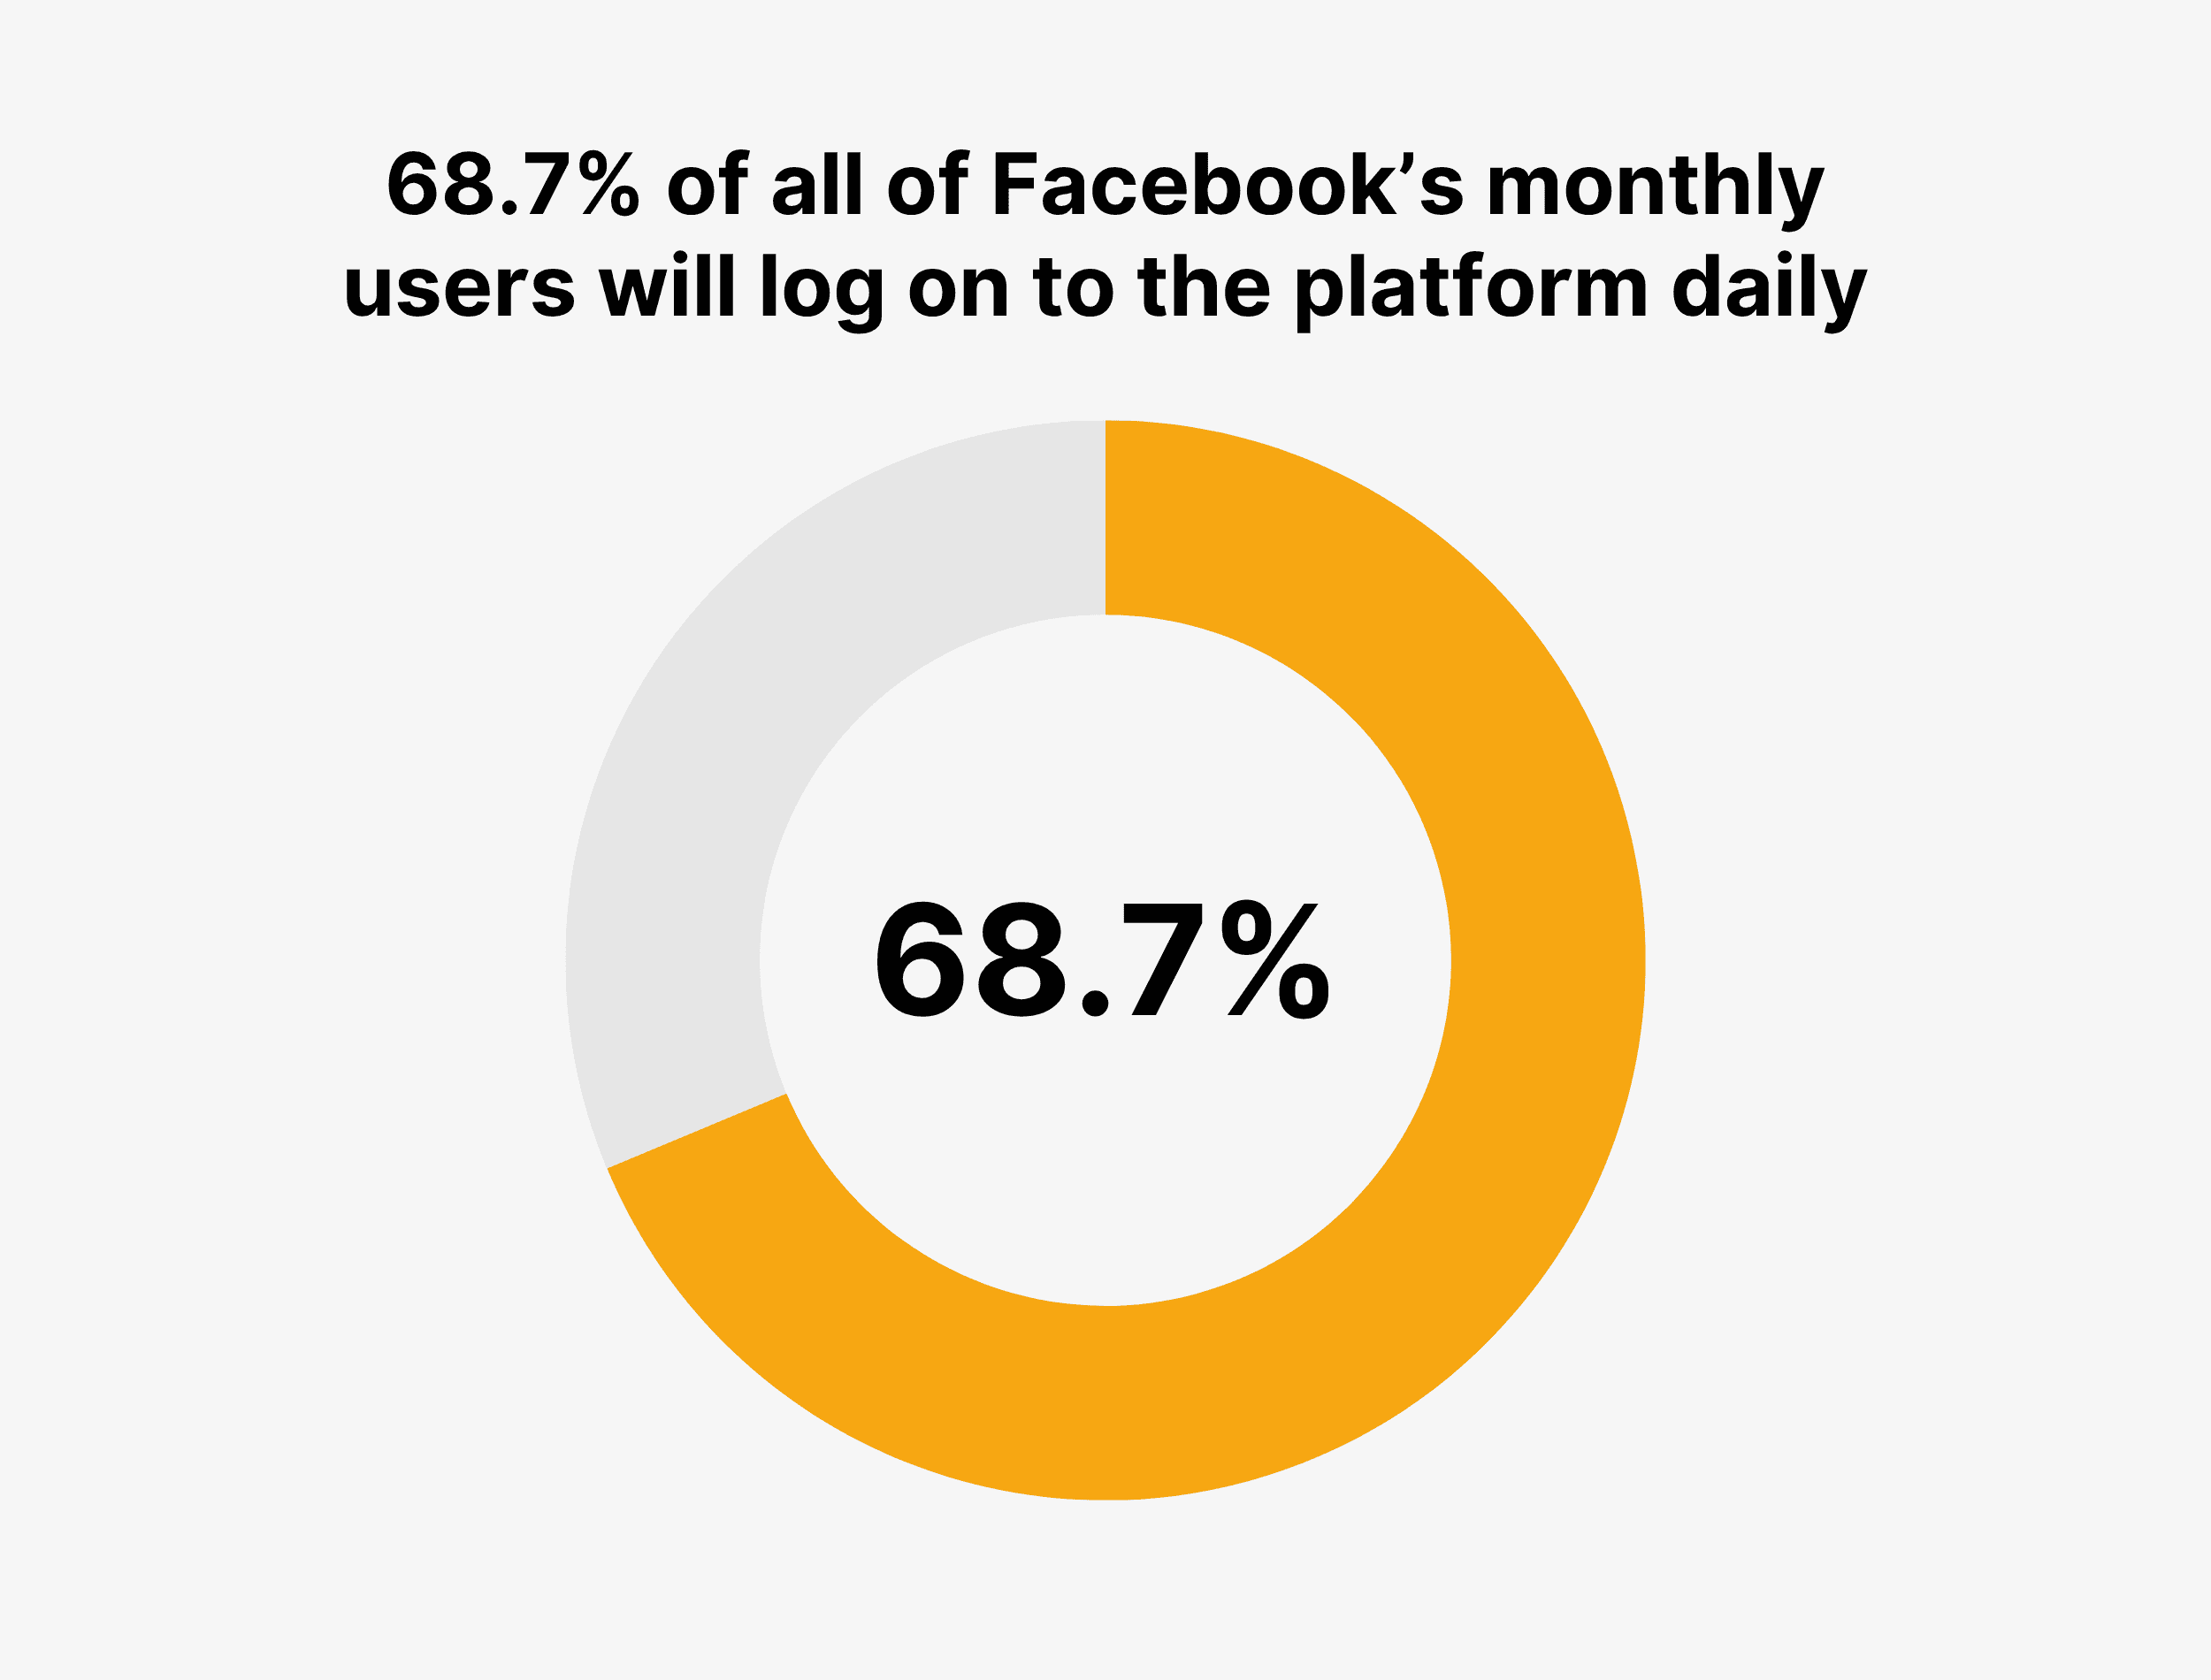
- 68.7% of all of Facebook’s monthly users will log on to the platform daily (Meta)
- Monday to Friday at 9 am and 10 am are optimal times to post on Facebook (Sprout Social)
- 44% of marketers cite Facebook as the most important social media platform, followed by Instagram (25%) and LinkedIn (21%) (Social Media Examiner)
- 83% of marketers use Facebook, more than any other social media channel (Statista)
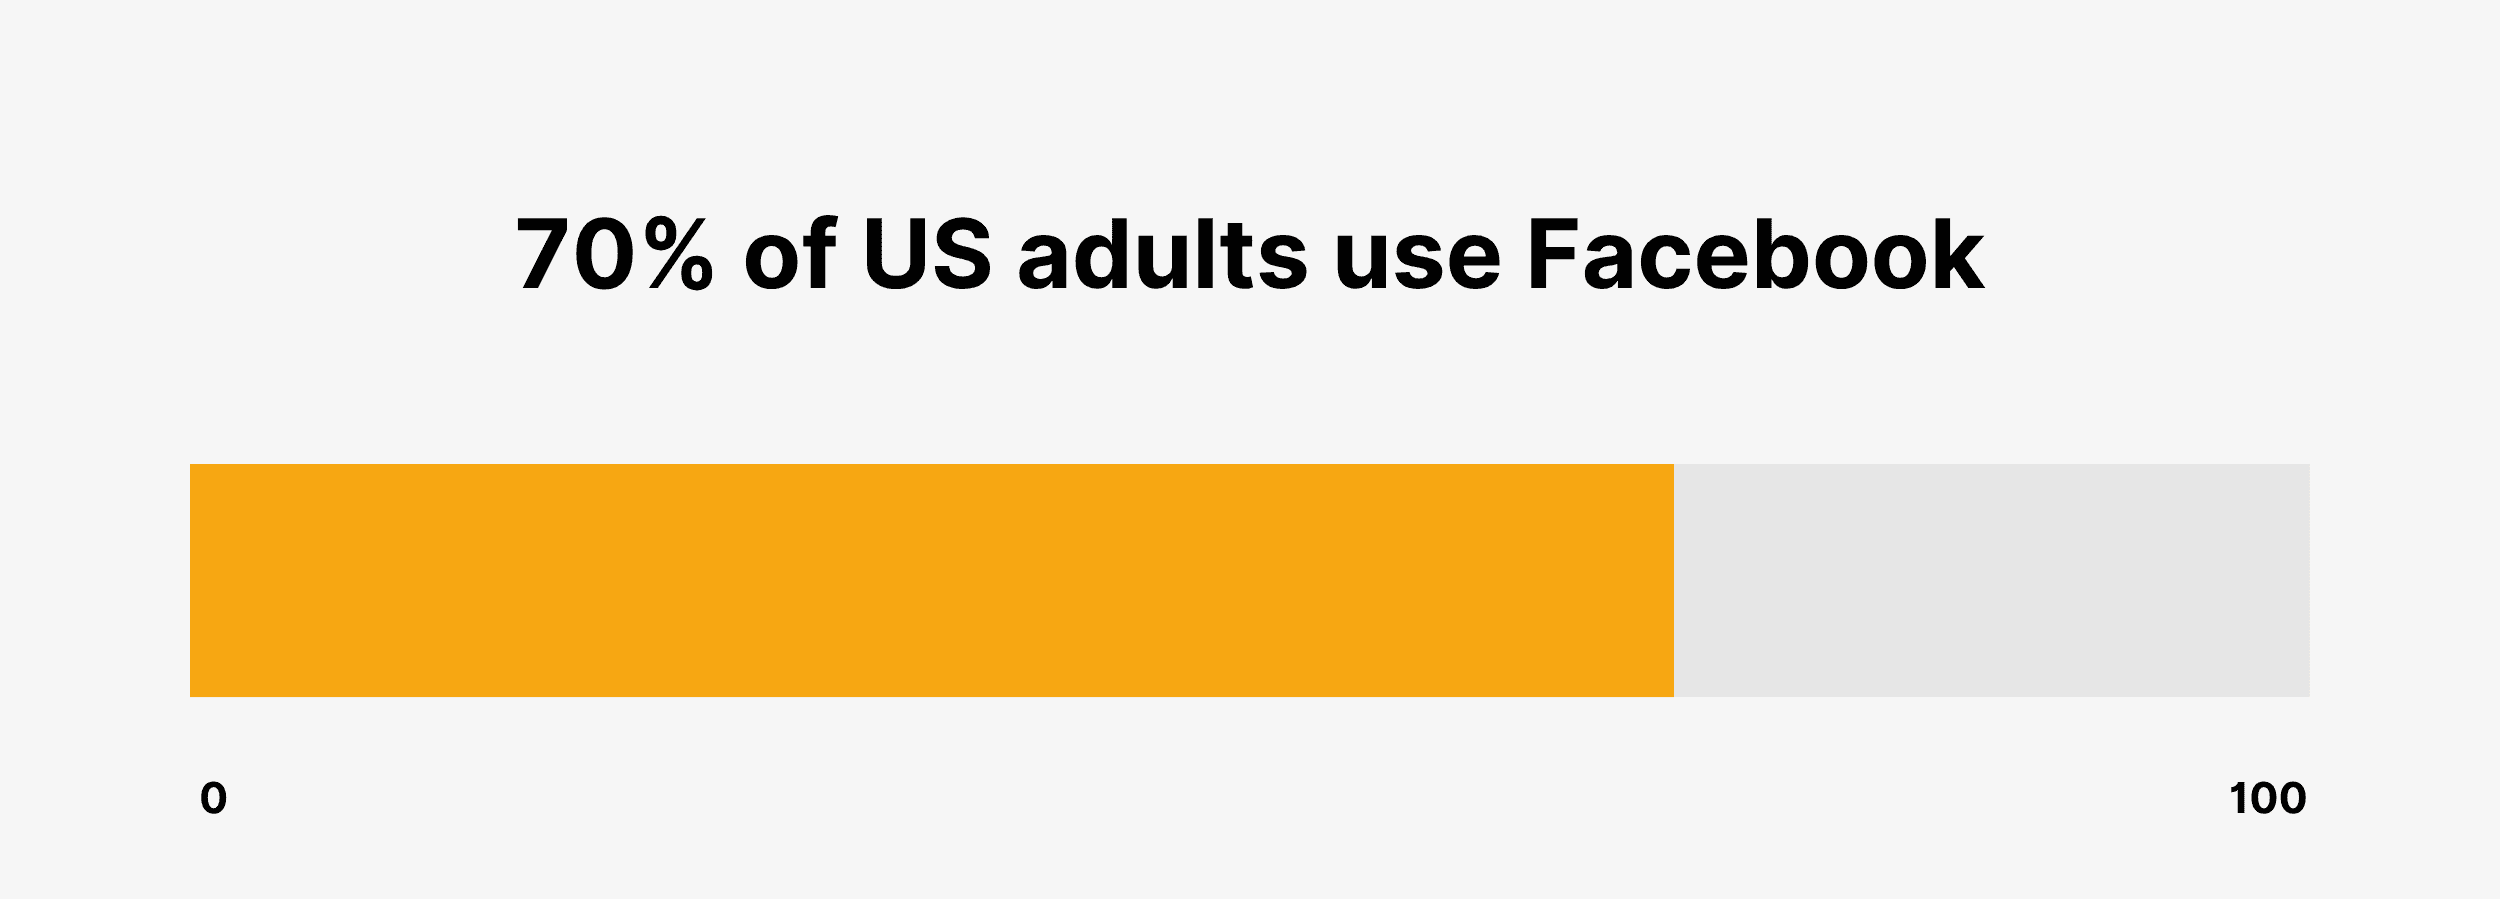
- 69% of U.S. adults use Facebook (Pew Research)
- The average monthly time spent on Facebook among US users reached around 10 hours in June 2024, more than any other social media app (eMarketer)
Note: Includes time spent only on the app, excluding mobile web.
- Globally, 56.6% of Facebook users are male compared to a 43.4% female user base (DataReportal)
- More than half (53%) of Facebook users worldwide are aged 34 and under (Statista)
- With 408.2 million active users, India is the country with the highest Facebook user count. The United States comes next with 198.1 million users, followed by Indonesia with 122.4 million, Brazil with 111 million, and Mexico with 95.85 million (DataReportal)
02.Instagram Marketing Statistics
Instagram marketing isn’t only for “influencers”. As you’re about to see, industry studies show that businesses of all shapes and sizes can benefit from having a presence on this growing platform.
- A study conducted by Rival IQ found that the median engagement rate on Instagram is 0.36%, compared to only 0.046% on Facebook and 0.015% on X/Twitter (Rival IQ)
- Mondays through Thursdays between 10 am and 3 pm are the best times to post on Instagram (Sprout Social)
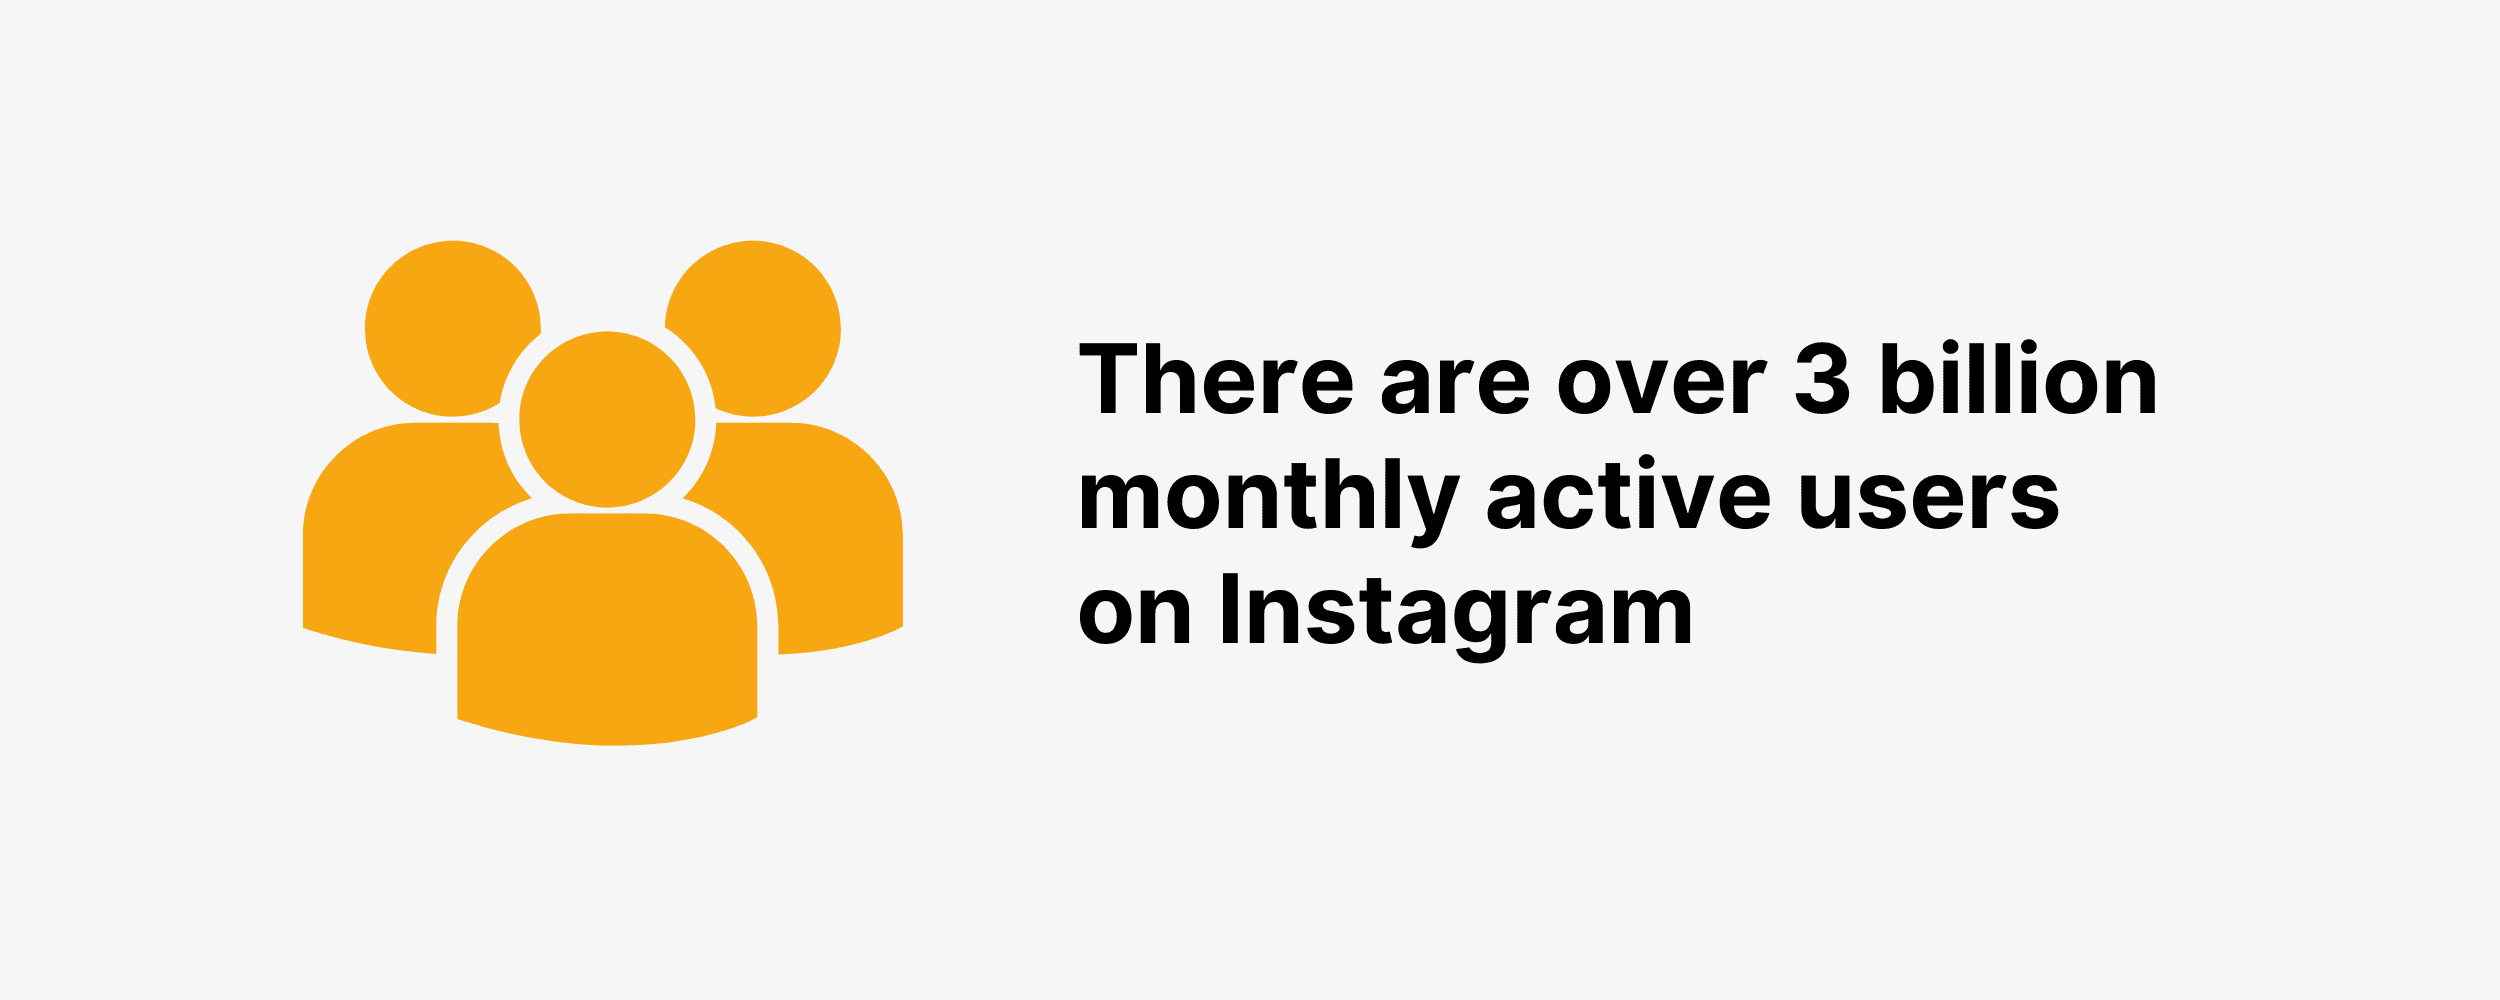
- There are over 3 billion monthly active users on Instagram (Reuters)
- The top 3 countries with the most Instagram users are India (472.6 million), the United States (179.9 million), and Brazil (147 million) (DataReportal)
- 50% of US adults use Instagram (Pew Research)
- 72.5% of US Gen Z use Instagram, slightly more than TikTok (72.1%) (eMarketer)
- Instagram is the most used social media platform among US marketers for influencer marketing (eMarketer)
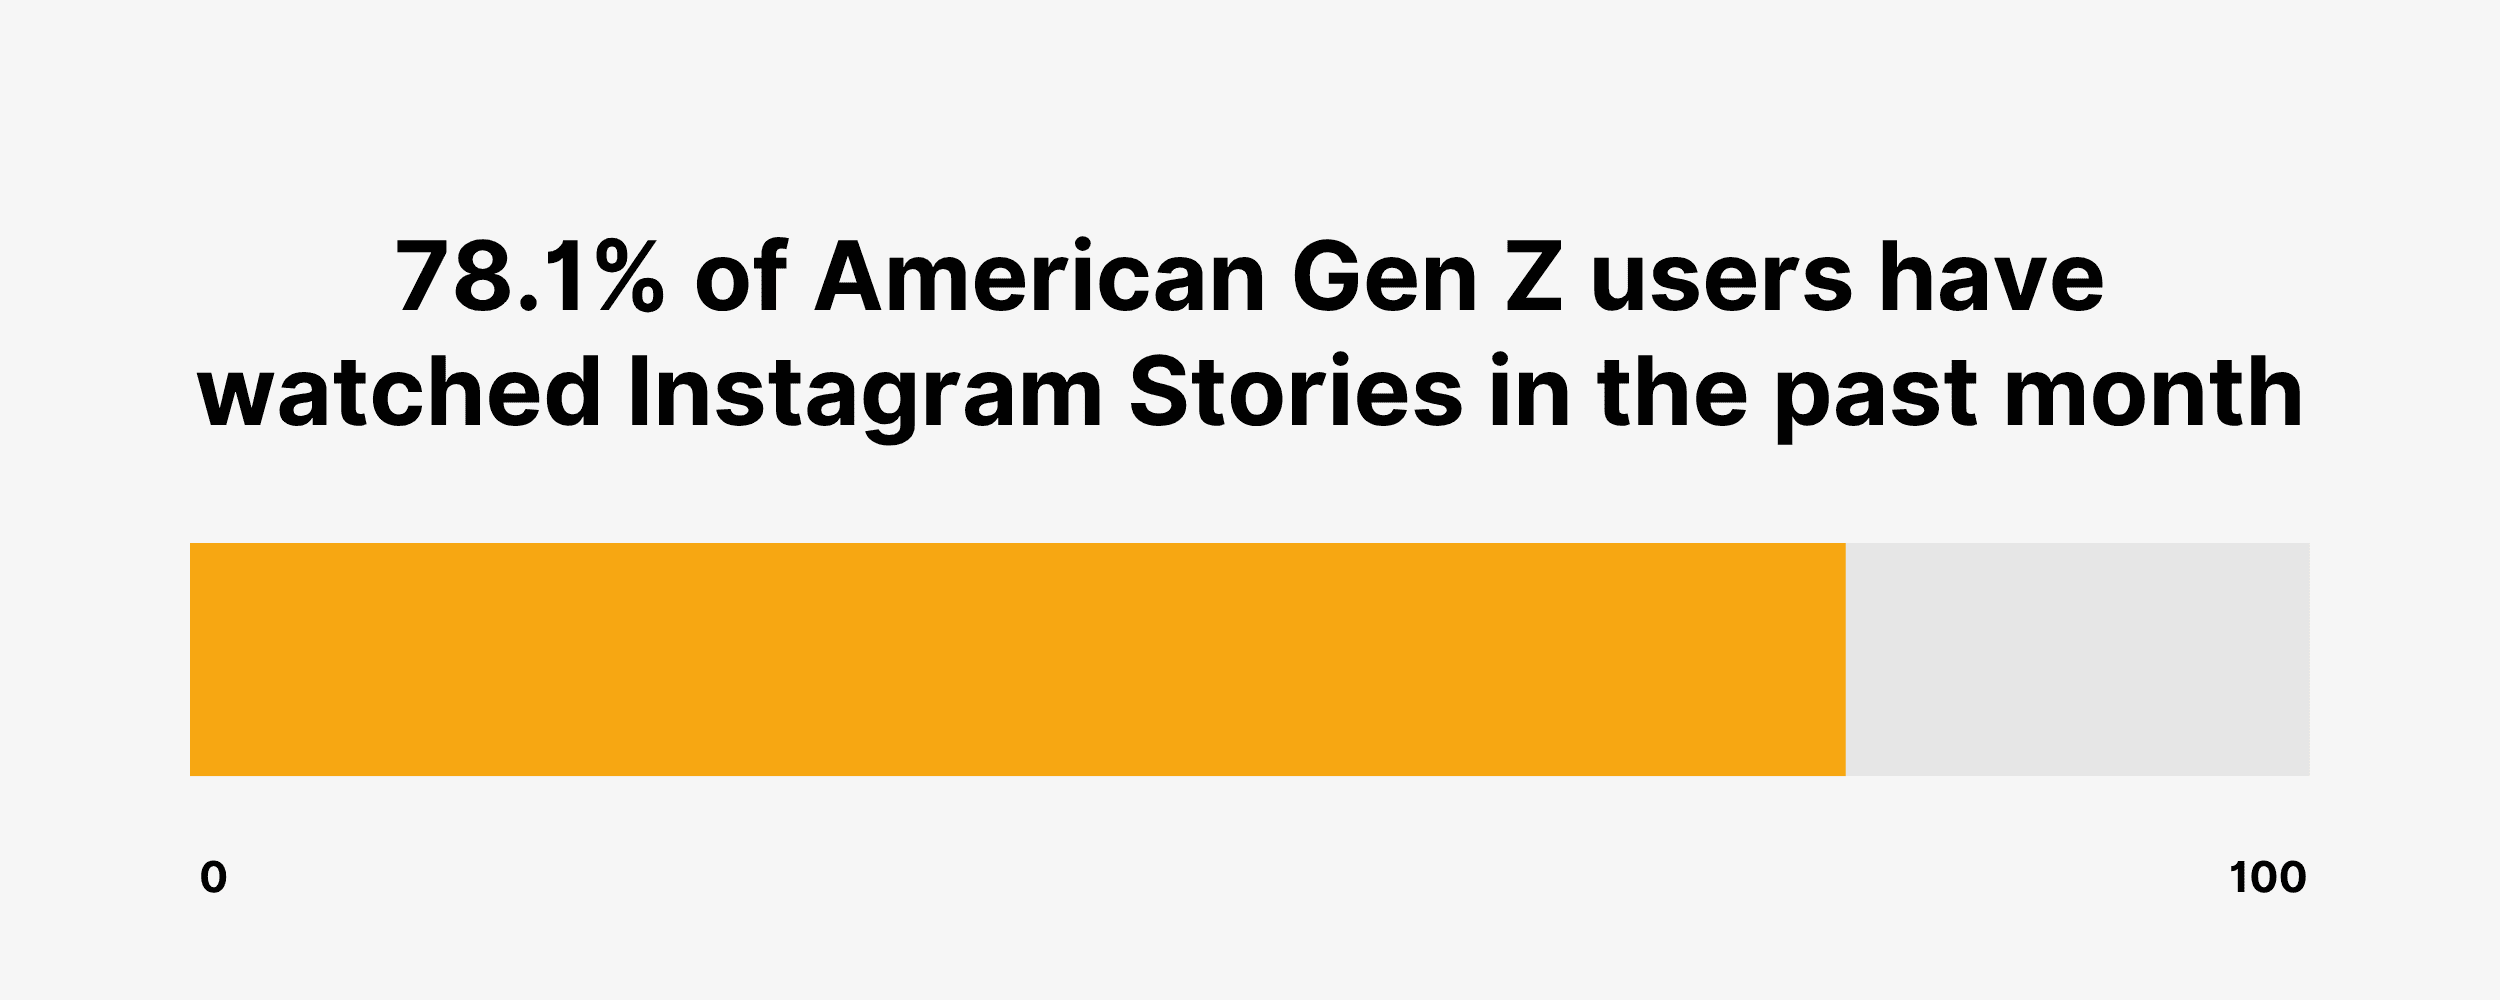
- A recent survey shows that 78.1% of American Gen Z users have watched Instagram Stories in the past month (eMarketer)
03.LinkedIn Statistics
LinkedIn may not be the hot new social media site (it was launched way back in 2003, before Facebook!). But since Microsoft acquired LinkedIn, they’ve modernized the platform in a big way. And B2B marketers are taking notice. Check out this list of social media marketing stats focused on LinkedIn to see why.
- Midweek between 10 am and noon is a popular time to post to LinkedIn company pages. (Sprout Social)
- According to 84% of B2B marketers, LinkedIn delivers the best value for organizations, more than any other social media platform (Content Marketing Institute)
- LinkedIn has over 1.2 billion registered users worldwide (LinkedIn)
- There are over 69 million companies listed on LinkedIn (LinkedIn)
- 79.75% of registered LinkedIn members reside outside of the US (LinkedIn)
- 32% of US adults use LinkedIn (Pew Research)
- 54% of US adults with a college degree use LinkedIn (Pew Research)
04.X (Twitter) Statistics
X/Twitter may not have the 1 billion+ user base of Facebook or YouTube. But it’s still one of the biggest social media sites on the planet. And for certain industries (like tech and business), it’s the undisputed go-to site.
- According to X/Twitter owner (Elon Musk), Twitter has 600 million monthly active users worldwide (X/Twitter)
- 21% of US adults use X/Twitter (Pew Research)
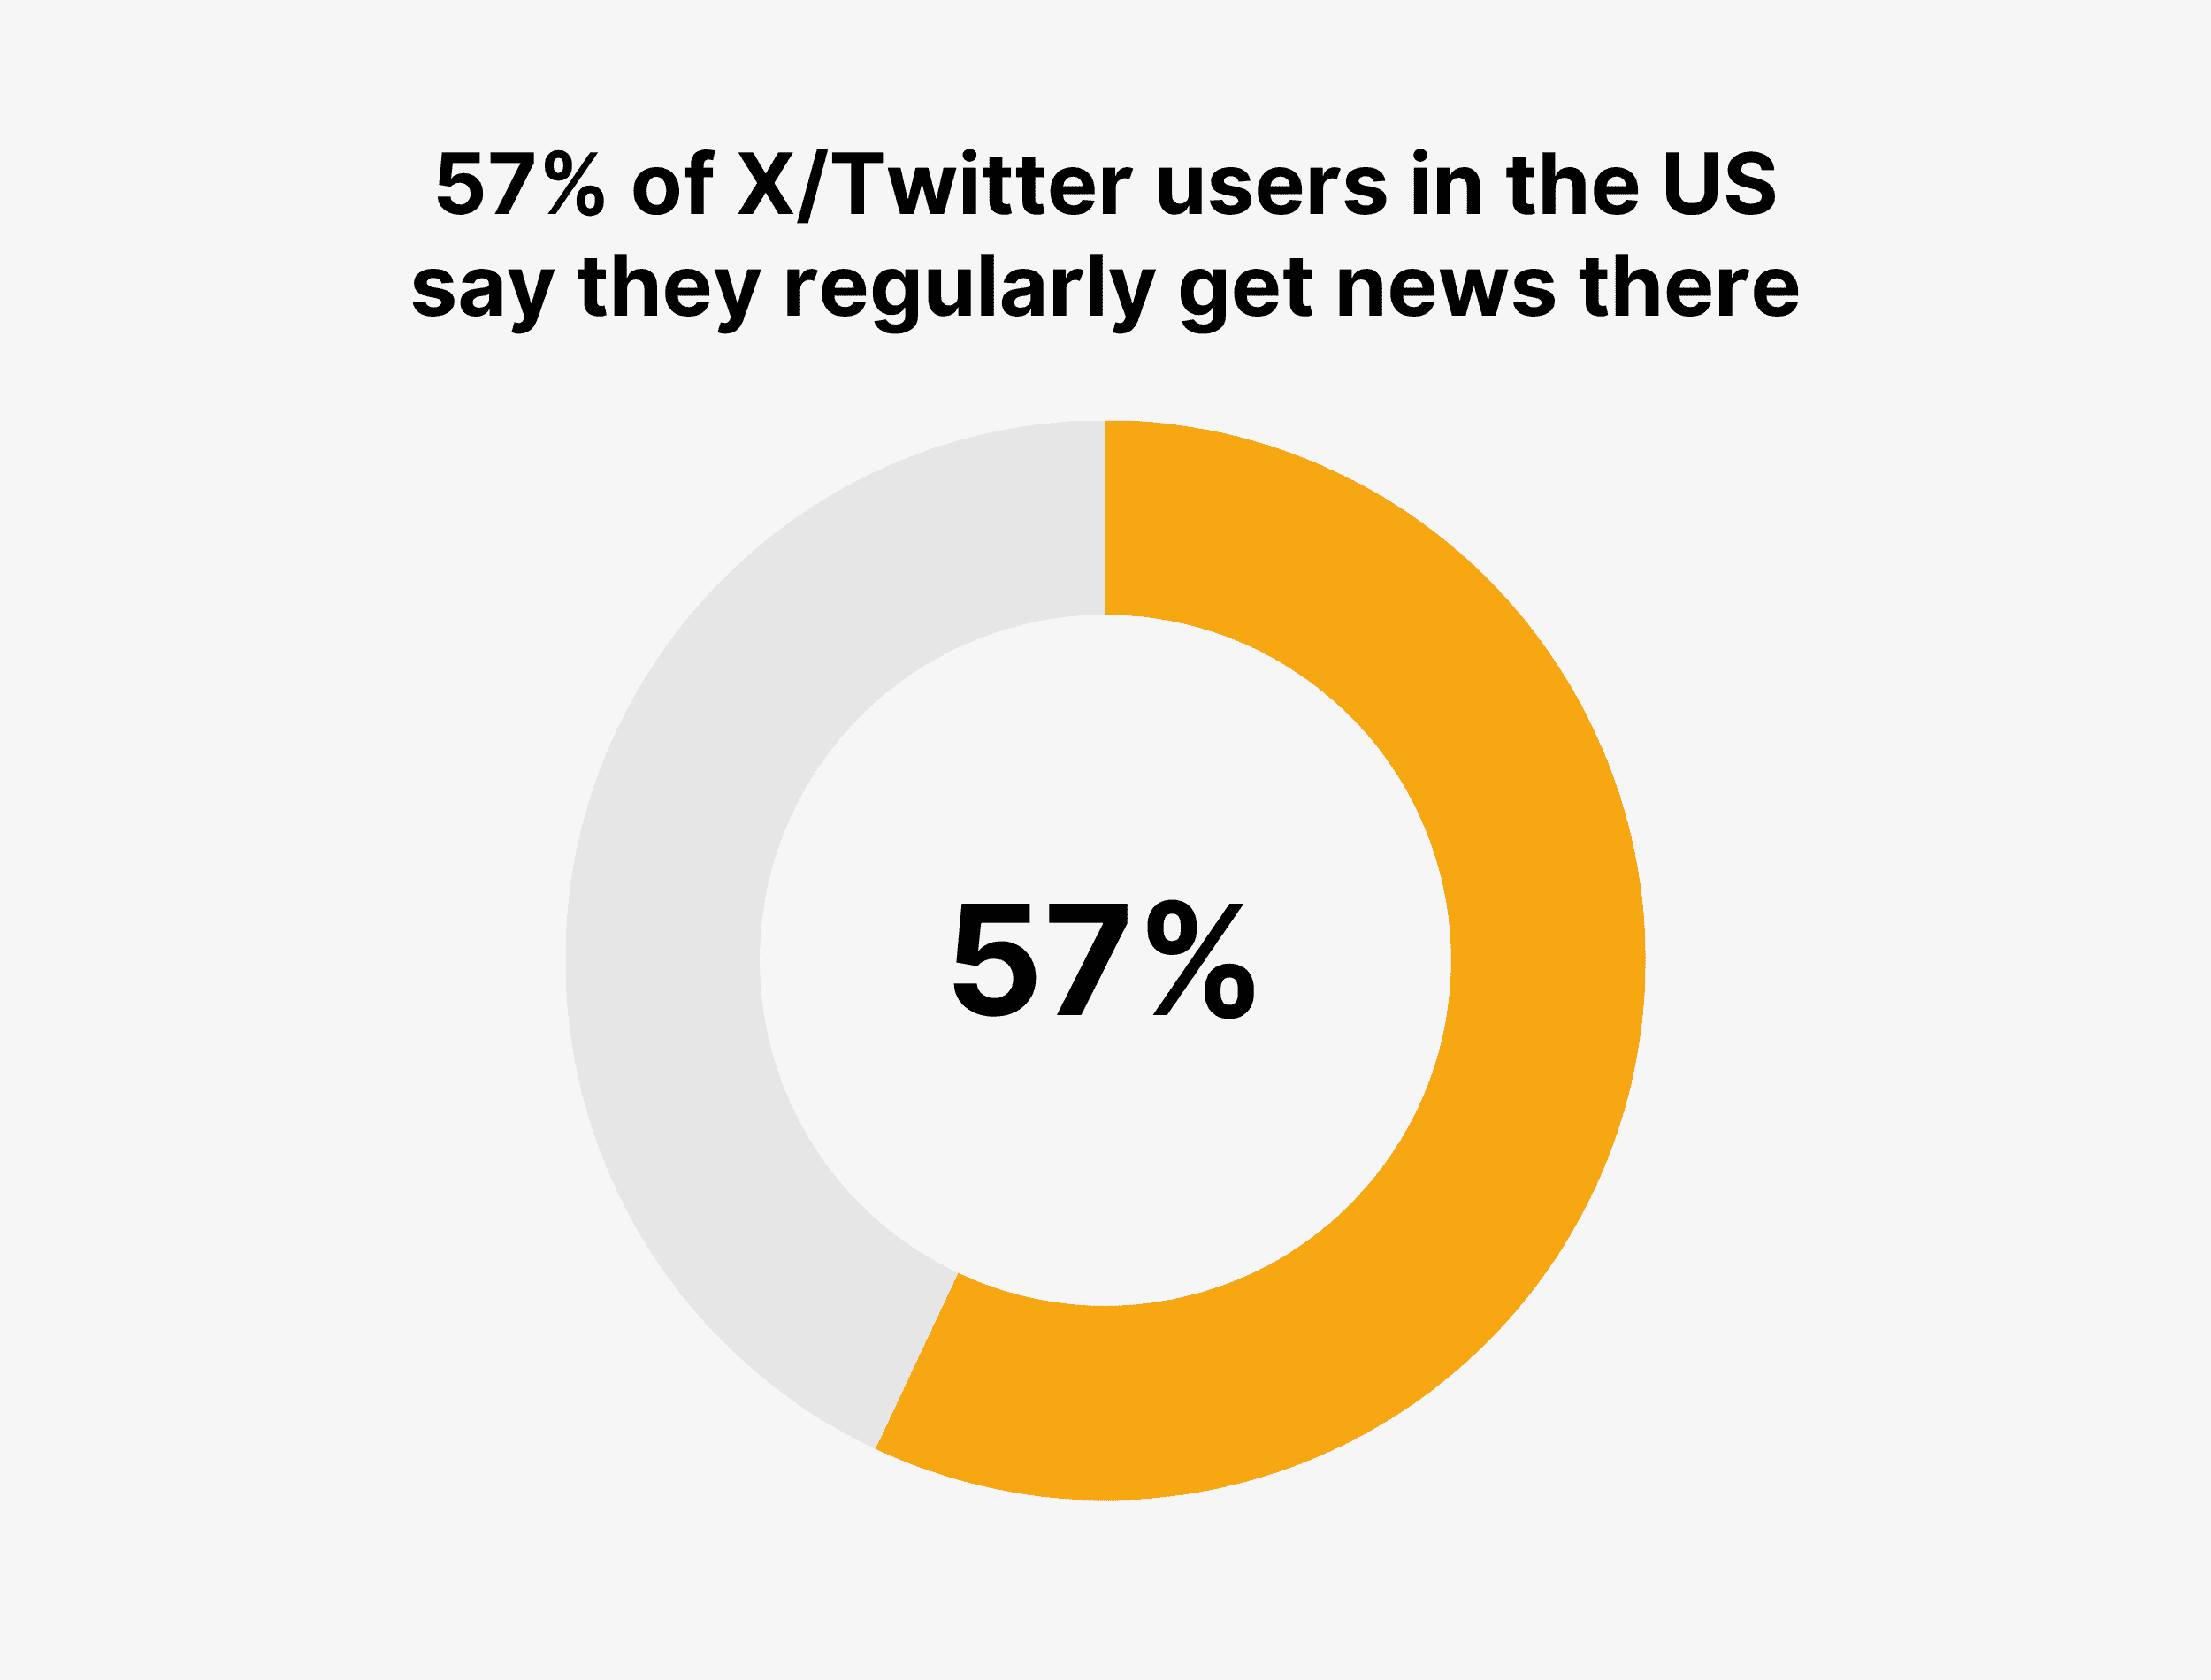
- 53% of X/Twitter users in the US say they regularly get news there (Pew Research)
- On average, X/Twitter users spend 32 minutes on the platform (X/Twitter)
- The best times to post on X/Twitter are Tuesdays through Thursdays from 9 am to 2 pm (Sprout Social)
- Mobile X/Twitter users in the US spend an average of 189.5 minutes each month on the app (eMarketer)
05.Pinterest Statistics
Should Pinterest be part of your social media marketing strategy? If so, how should you use the platform to turn pins into more sales for your business? Well, these Pinterest marketing stats will help you answer those questions.
- Pinterest has 578 million monthly active users (Pinterest)
- 36% of US adults use Pinterest (Pew Research)
- Worldwide, Pinterest’s audience is 70% women and 28% men (Pinterest)
- Gen Z accounts for 42% of Pinterest’s user base worldwide (Pinterest)

- In the US, 40% of households with incomes surpassing $150,000 per year are active users of Pinterest (Pinterest)
- 28% of Gen Z social media users say they’ve used Pinterest for shopping/product discovery in the past month, which is only behind TikTok (52.5%) and Instagram (50.3%) (eMarketer)
- 23% of B2C marketers used Pinterest to promote their business within the last 12 months (Content Marketing Institute)
06.YouTube Statistics
It’s hard to believe that, with 1 billion active users, YouTube is still growing. How big is YouTube in 2026? And how do people consume video content on YouTube? Let’s find out.
- YouTube holds the #1 spot for the most widely used social media platform among US adults (Pew Research)
- 85% of US adults use YouTube (Pew Research)
- 89.3% of US Gen Z internet users use YouTube at least once per month, making it the most popular digital platform among Gen Z (eMarketer)

- 79% of marketers claim they publish videos on YouTube, more than on LinkedIn (76%), Facebook (72%), or any other social platform (Content Marketing Institute)
- Brian Dean analyzed 1.3 million YouTube Videos and found that comment count, views, shares, and likes are all strongly correlated with higher rankings on YouTube (Backlinko)
- The average video ranking on YouTube’s first page of results is 14 minutes and 50 seconds in length (Backlinko)
- More than 500 hours of content is uploaded to YouTube every minute (Statista)

- 25% of US adults claim to start their online product searches on YouTube. Among Gen Z, that’s as much as 42% (eMarketer)
07.Snapchat Statistics
Snapchat definitely skews to a younger demographic. That said, if your target audience is 18-29, then it might be a platform to try out. These stats will help you figure out whether or not Snapchat makes sense for you.
- Snapchat has 932 million monthly active users across the world (Snapchat)
- Snapchat has 469 million daily active users worldwide (Snapchat)
- There are roughly 3.3 million Snaps created every minute on Snapchat (Snapchat)

- 27% of US adults use Snapchat (Pew Research)
- 65% of people in the US aged 18-29 years old use Snapchat (Pew Research)
- Snapchat users in the US aged 18 to 24 spend an average of 28 minutes per day on the platform (eMarketer)
- US social media ad spending is estimated to reach $82.23 billion in 2025 (eMarketer)
- Global social media ad spending is estimated to hit $276.72 billion in 2025, showing a 13.6 % year-over-year increase (Statista)
- 27% of marketers claim to use Facebook Ads often, followed by Instagram Ads (23%) and YouTube Ads (7%) (Social Media Examiner)

- Facebook ads have a median cost-per-click of $0.54 (Databox)
- One study found that the median CTR on Facebook Ads was 1.44% (Databox)
- The percentage of the marketing budget dedicated to social media spending reached 11.3% in Spring 2025 and is expected to reach 13.3% in the next 12 months (CMO Survey)
- Approximately 4.05 billion people use social media (eMarketer)
- 83% of marketers use Facebook. Instagram comes in second with 78%, followed by LinkedIn (69%) and YouTube (53%) (Statista)
- 51% of marketers believe that their social media efforts have improved sales (Social Media Examiner)

- When it comes to generating exposure for business, marketers cite TikTok (73%), YouTube (70%), and Instagram (69%) as having a major impact on that (Social Media Examiner)
- The average daily time spent on social media worldwide reached 2 hours and 21 minutes in 2025 (DataReportal)
- As of February 2025, the number of global active users for Facebook is 3.07 billion, YouTube is 2.53 billion, Instagram is 2 billion, WhatsApp is 2 billion, and TikTok is 1.59 billion (Statista)
- Backlinko and Buzzsumo teamed up to analyze 912 million blog posts and found that headlines containing 14-17 words result in 76.7% more social shares compared to short headlines (Backlinko)
- A study conducted by Rival IQ found that the average number of weekly Instagram posts is 4.5, Facebook posts is 4.19, and X/Twitter posts is 2.16 (Rival IQ)
- The top 3 video marketing channels that marketers use are LinkedIn (70%), Facebook (66%), and Instagram (66%) (Wyzowl)
Conclusion
There you have it: my giant list of social media marketing statistics.
Considering how quickly social media changes, this list will be kept up to date. That way, you never have to wonder: “Are these stats still relevant?”.


08.Social Media Advertising Stats
Does advertising on social media work? If so, what platforms and approaches have the highest ROI? Let’s see what the stats have to say.