Fiverr is a freelance marketplace for digital services. It is used by 3.5 million buyers each year.
Fiverr launched its platform with 8 service categories in 2010. And the platform crossed $1 million in monthly gross merchandise value the following year.
Since then, Fiverr has grown its gross merchandise value and revenue.
Today, the platform covers more than 700 service categories and generates $361.38 million in annual revenue.
Continue reading to see the latest Fiverr statistics for 2026.
From revenue to employee count, here’s a breakdown of what you’ll find on this page:
- Fiverr Usage Stats (Top Picks)
- How Many Buyers Are on Fiverr?
- Fiverr Gross Merchandise Value (GMV)
- Fiverr Revenue
- Fiverr Revenue from Repeat Buyers
- Fiverr Revenue by Geography
- Fiverr Annual Spend per Buyer
- Fiverr Take Rate
- Fiverr Net Promoter Score
- How Many Categories Are Available on Fiverr?
- How Many People Work at Fiverr?
Fiverr Usage Stats (Top Picks)
- Fiverr has 3.5 million active buyers.
- Fiverr processed $1.13 billion in gross merchandise value in 2023.
- Annual revenue for 2024 was $391.5 million.
- Freelancers on Fiverr offer services across more than 700 categories.
- 762 employees work at Fiverr.
How Many Buyers Are on Fiverr?
Fiverr defines an active buyer as a user who purchased at least one “gig” (service) from a freelancer on the platform within the last 12 months.
As of March 2025, Fiverr had 3.5 million active buyers from over 160 countries. That’s down from the reported 4 million in 2024.
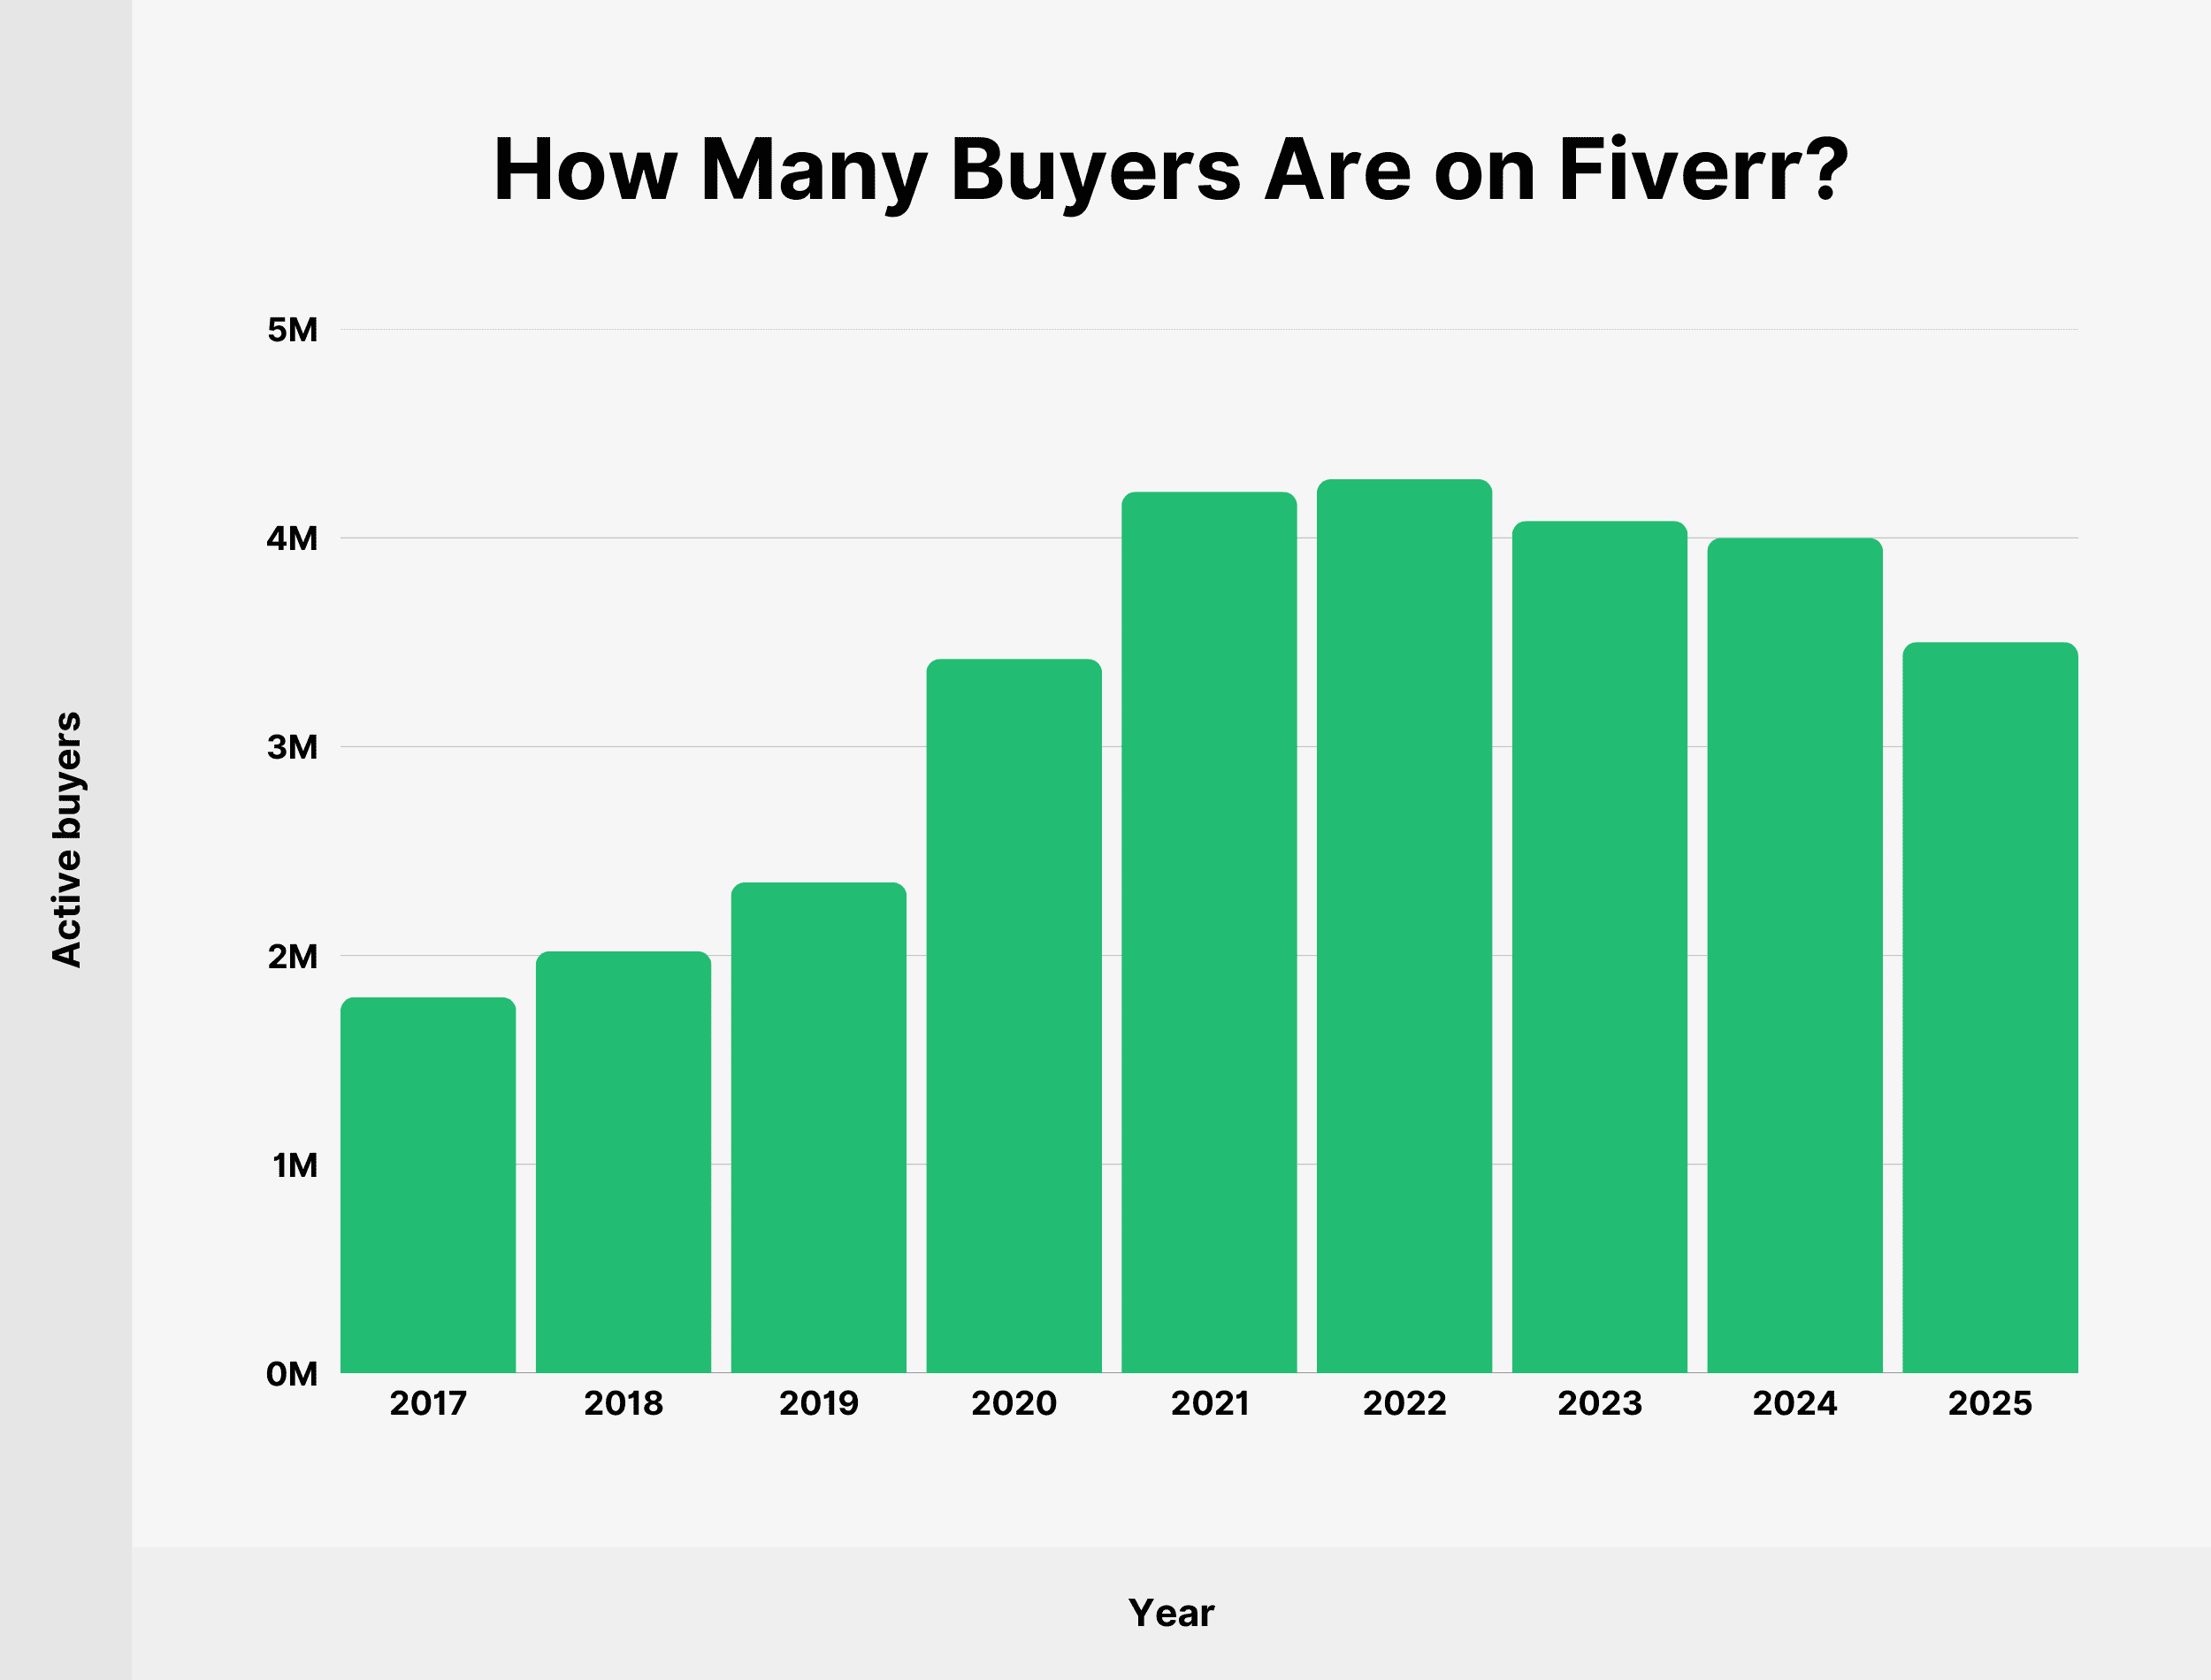
In fact, the growth of the active buyer base has declined from a peak of 4.28 million in 2022 to date.
Here’s a table showing the number of active buyers on Fiverr since 2017:
| Year | Active buyers |
|---|---|
| 2017 | 1.8 million |
| 2018 | 2.02 million |
| 2019 | 2.35 million |
| 2020 | 3.42 million |
| 2021 | 4.22 million |
| 2022 | 4.28 million |
| 2023 | 4.08 million |
| 2024 | 4.0 million |
| 2025 | 5.0 million |
Source: Fiverr
Fiverr Gross Merchandise Value (GMV)
Fiverr processed $1.13 billion worth of transactions in 2023, which remained largely unchanged from $1.12 billion in 2022.

Here’s a table showing Fiverr’s gross merchandise value since 2017:
| Year | Fiverr Gross Merchandise Value |
|---|---|
| 2017 | $213 million |
| 2018 | $293.5 million |
| 2019 | $401 million |
| 2020 | $699.3 million |
| 2021 | $1.02 billion |
| 2022 | $1.12 billion |
| 2023 | $1.13 billion |
Source: Fiverr
Fiverr Revenue
Fiverr’s revenue mainly consists of transaction and service fees.
Fiverr generated $391.5 million in revenue in 2024. And $107.2 million in Q1 2025 alone.
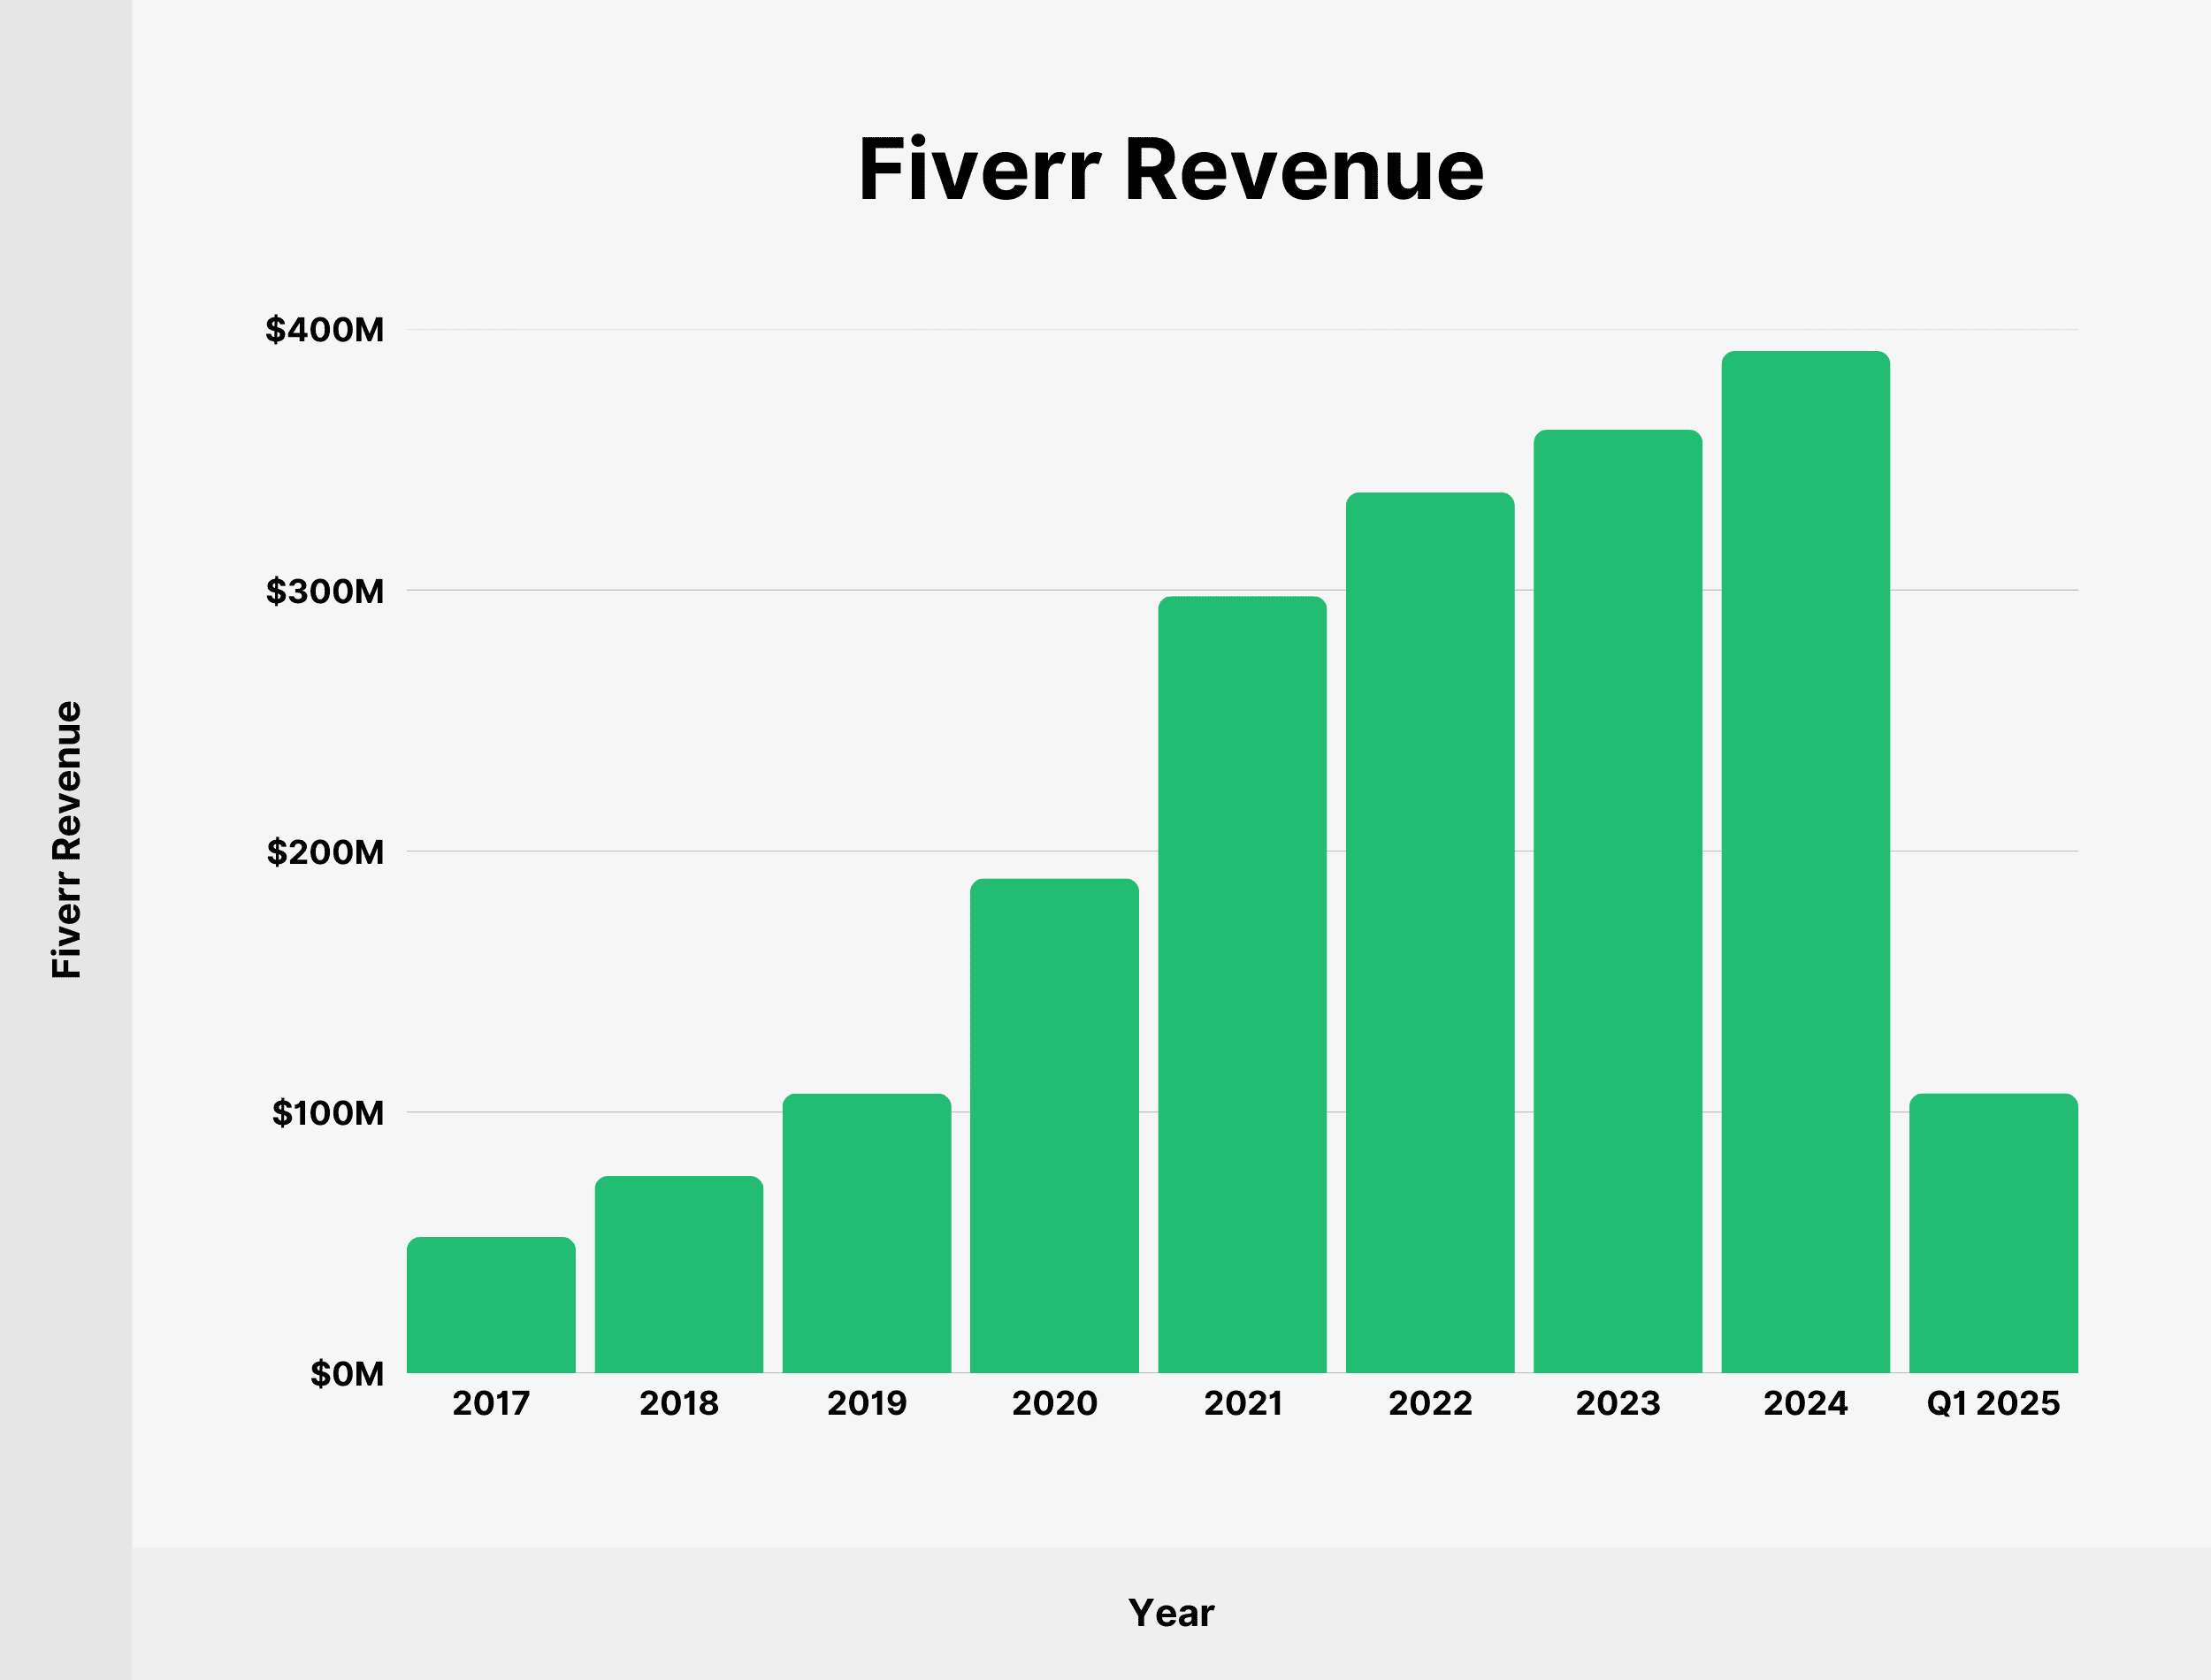
We’ve charted Fiverr’s revenue growth since 2017:
| Year | Fiverr Revenue |
|---|---|
| 2017 | $52.11 million |
| 2018 | $75.5 million |
| 2019 | $107.07 million |
| 2020 | $189.51 million |
| 2021 | $297.66 million |
| 2022 | $337.37 million |
| 2023 | $361.38 million |
| 2024 | $391.5 million |
| 2025 | $107.2 million |
Source: Fiverr
Fiverr Revenue from Repeat Buyers
As of March 2024, Fiverr generates more than half (67%) of its revenue from repeat buyers.
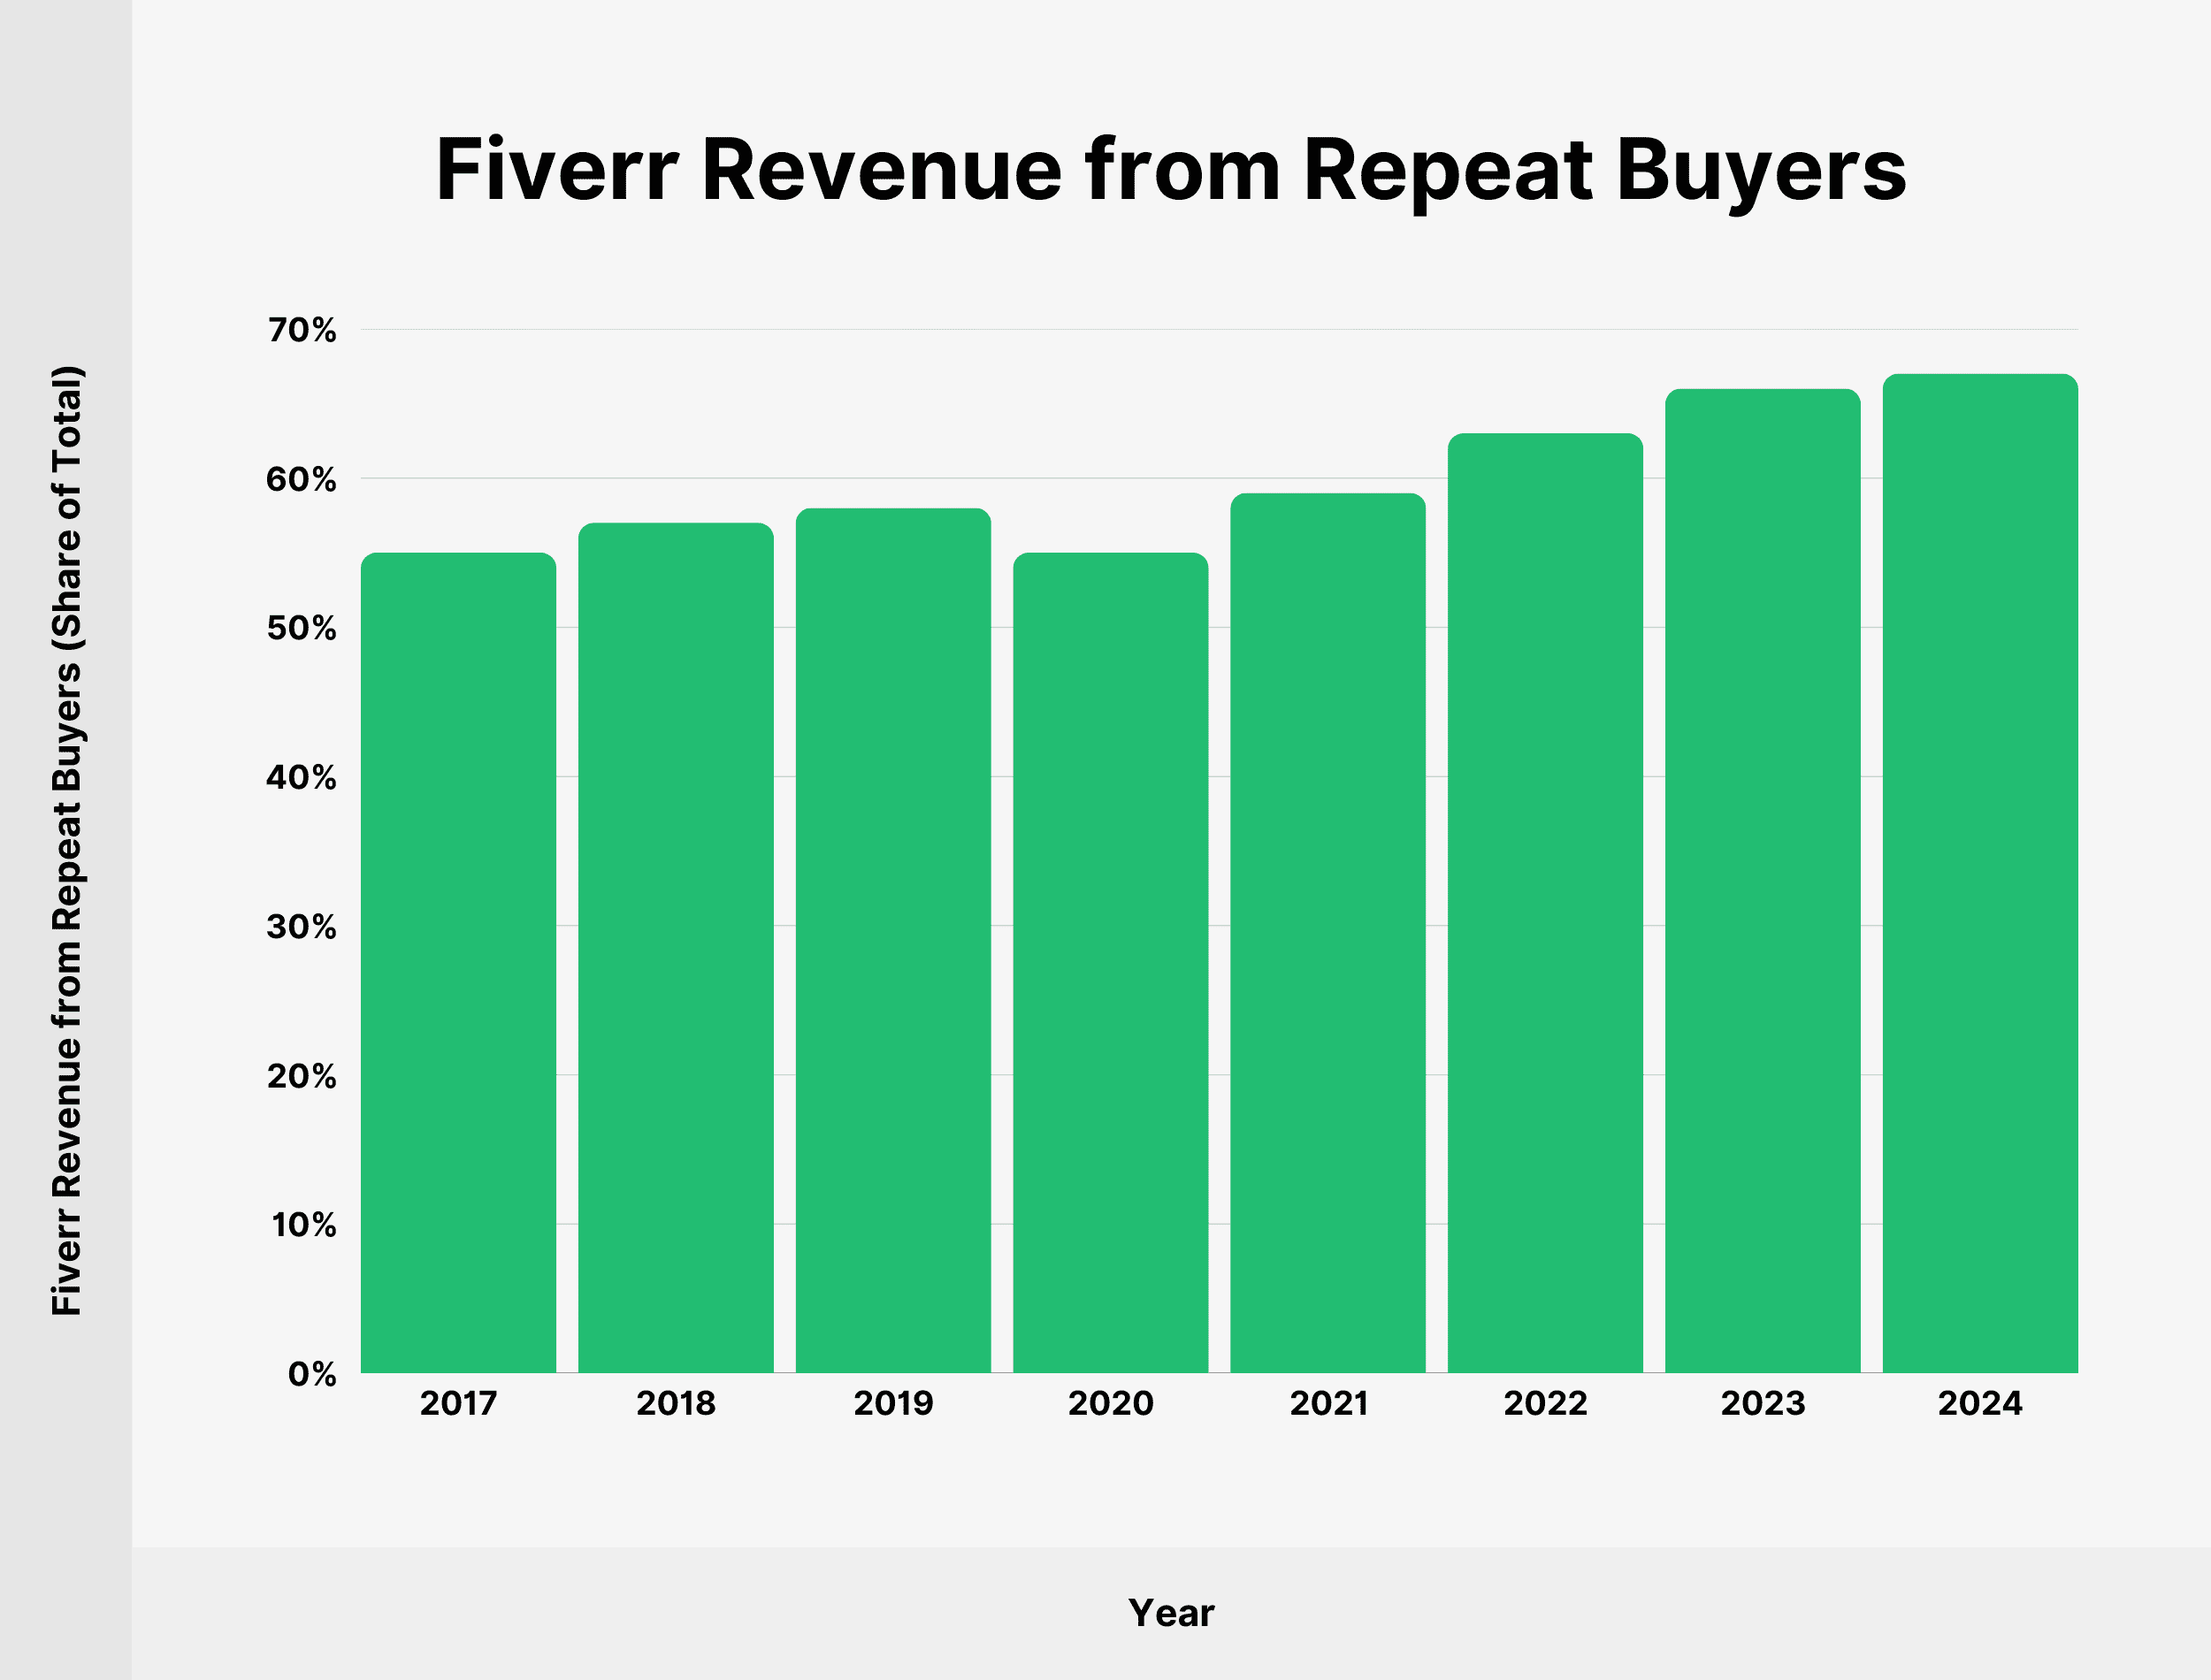
Revenue from new buyers at 45% or below since reporting began in 2017:
| Year | Fiverr Revenue from Repeat Buyers (Share of Total) |
|---|---|
| 2017 | 55% |
| 2018 | 57% |
| 2019 | 58% |
| 2020 | 55% |
| 2021 | 59% |
| 2022 | 63% |
| 2023 | 66% |
| 2024 | 67% |
Source: Fiverr
Fiverr Revenue by Geography
75.83% of Fiverr’s revenue comes from buyers in the US and Europe.

US buyers alone are responsible for nearly half (49.38%) of Fiverr’s annual revenue. The total revenue from US buyers amounted to $178.45 million in 2023.
Here’s a table with Fiverr’s revenue from buyers in the US since 2017:
| Year | Fiverr US Revenue (Share of Total Revenue) |
|---|---|
| 2017 | $28.26 million (54.23%) |
| 2018 | $40.53 million (53.68%) |
| 2019 | $57.94 million (54.11%) |
| 2020 | $100.7 million (53.14%) |
| 2021 | $154.36 million (51.86%) |
| 2022 | $172.7 million (51.19%) |
| 2023 | $178.45 million (49.38%) |
Europe contributed 26.45% ($95.59 million) of Fiverr’s annual revenue in 2023.
Here’s a table showing Fiverr’s European revenue since 2017:
| Year | Fiverr Europe Revenue (Share of Total Revenue) |
|---|---|
| 2017 | $10.14 million (19.46%) |
| 2018 | $15.26 million (20.21%) |
| 2019 | $25.18 million (23.52%) |
| 2020 | $48.33 million (25.5%) |
| 2021 | $77.02 million (25.87%) |
| 2022 | $84.48 million (25.04%) |
| 2023 | $95.59 million (26.45%) |
Fiverr’s revenue from buyers in the Asia Pacific region amounted to $54.4 million in 2023. That’s 15.05% of total revenue.
We’ve charted Fiverr’s Asia Pacific revenue since 2017:
| Year | Fiverr Asia Pacific Revenue (Share of Total Revenue) |
|---|---|
| 2017 | $7.84 million (15.04%) |
| 2018 | $11.08 million (14.67%) |
| 2019 | $13.36 million (12.48%) |
| 2020 | $22.81 million (12.04%) |
| 2021 | $38.44 million (12.91%) |
| 2022 | $48.59 million (14.4%) |
| 2023 | $54.4 million (15.05%) |
Fiverr has its HQ in Israel and keeps track of revenue generated from its home country. Israel-based buyers contributed $3.27 million (0.9%) to the organization’s annual revenue in 2023.
Here’s a table with Fiverr’s revenue from Israel since 2017:
| Year | Fiverr Israel Revenue (Share of Total Revenue) |
|---|---|
| 2017 | $717 thousand (1.38%) |
| 2018 | $1.16 million (1.54%) |
| 2019 | $1.22 million (1.14%) |
| 2020 | $1.94 million (1.02%) |
| 2021 | $2.86 million (0.96%) |
| 2022 | $3.44 million (1.02%) |
| 2023 | $3.27 million (0.9%) |
Revenue from buyers in geographical areas outside of the US, Europe, Asia Pacific, and Israel accounts for 8.21% of Fiverr’s annual revenue. In 2023, that totaled $29.66 million.
We’ve charted Fiverr’s revenue from markets outside of the US, Europe, Asia Pacific, and Israel since 2017:
| Year | Fiverr Rest of the World Revenue (Share of Total Revenue) |
|---|---|
| 2017 | $5.15 million (9.88%) |
| 2018 | $7.48 million (9.9%) |
| 2019 | $9.37 million (8.75%) |
| 2020 | $15.71 million (8.29%) |
| 2021 | $24.99 million (8.4%) |
| 2022 | $28.15 million (8.34%) |
| 2023 | $29.66 million (8.21%) |
Source: Fiverr
Fiverr Annual Spend per Buyer
Buyers on Fiverr spent an average of $309 in 2025. Average annual spending has grown by 8.8% over the previous year.
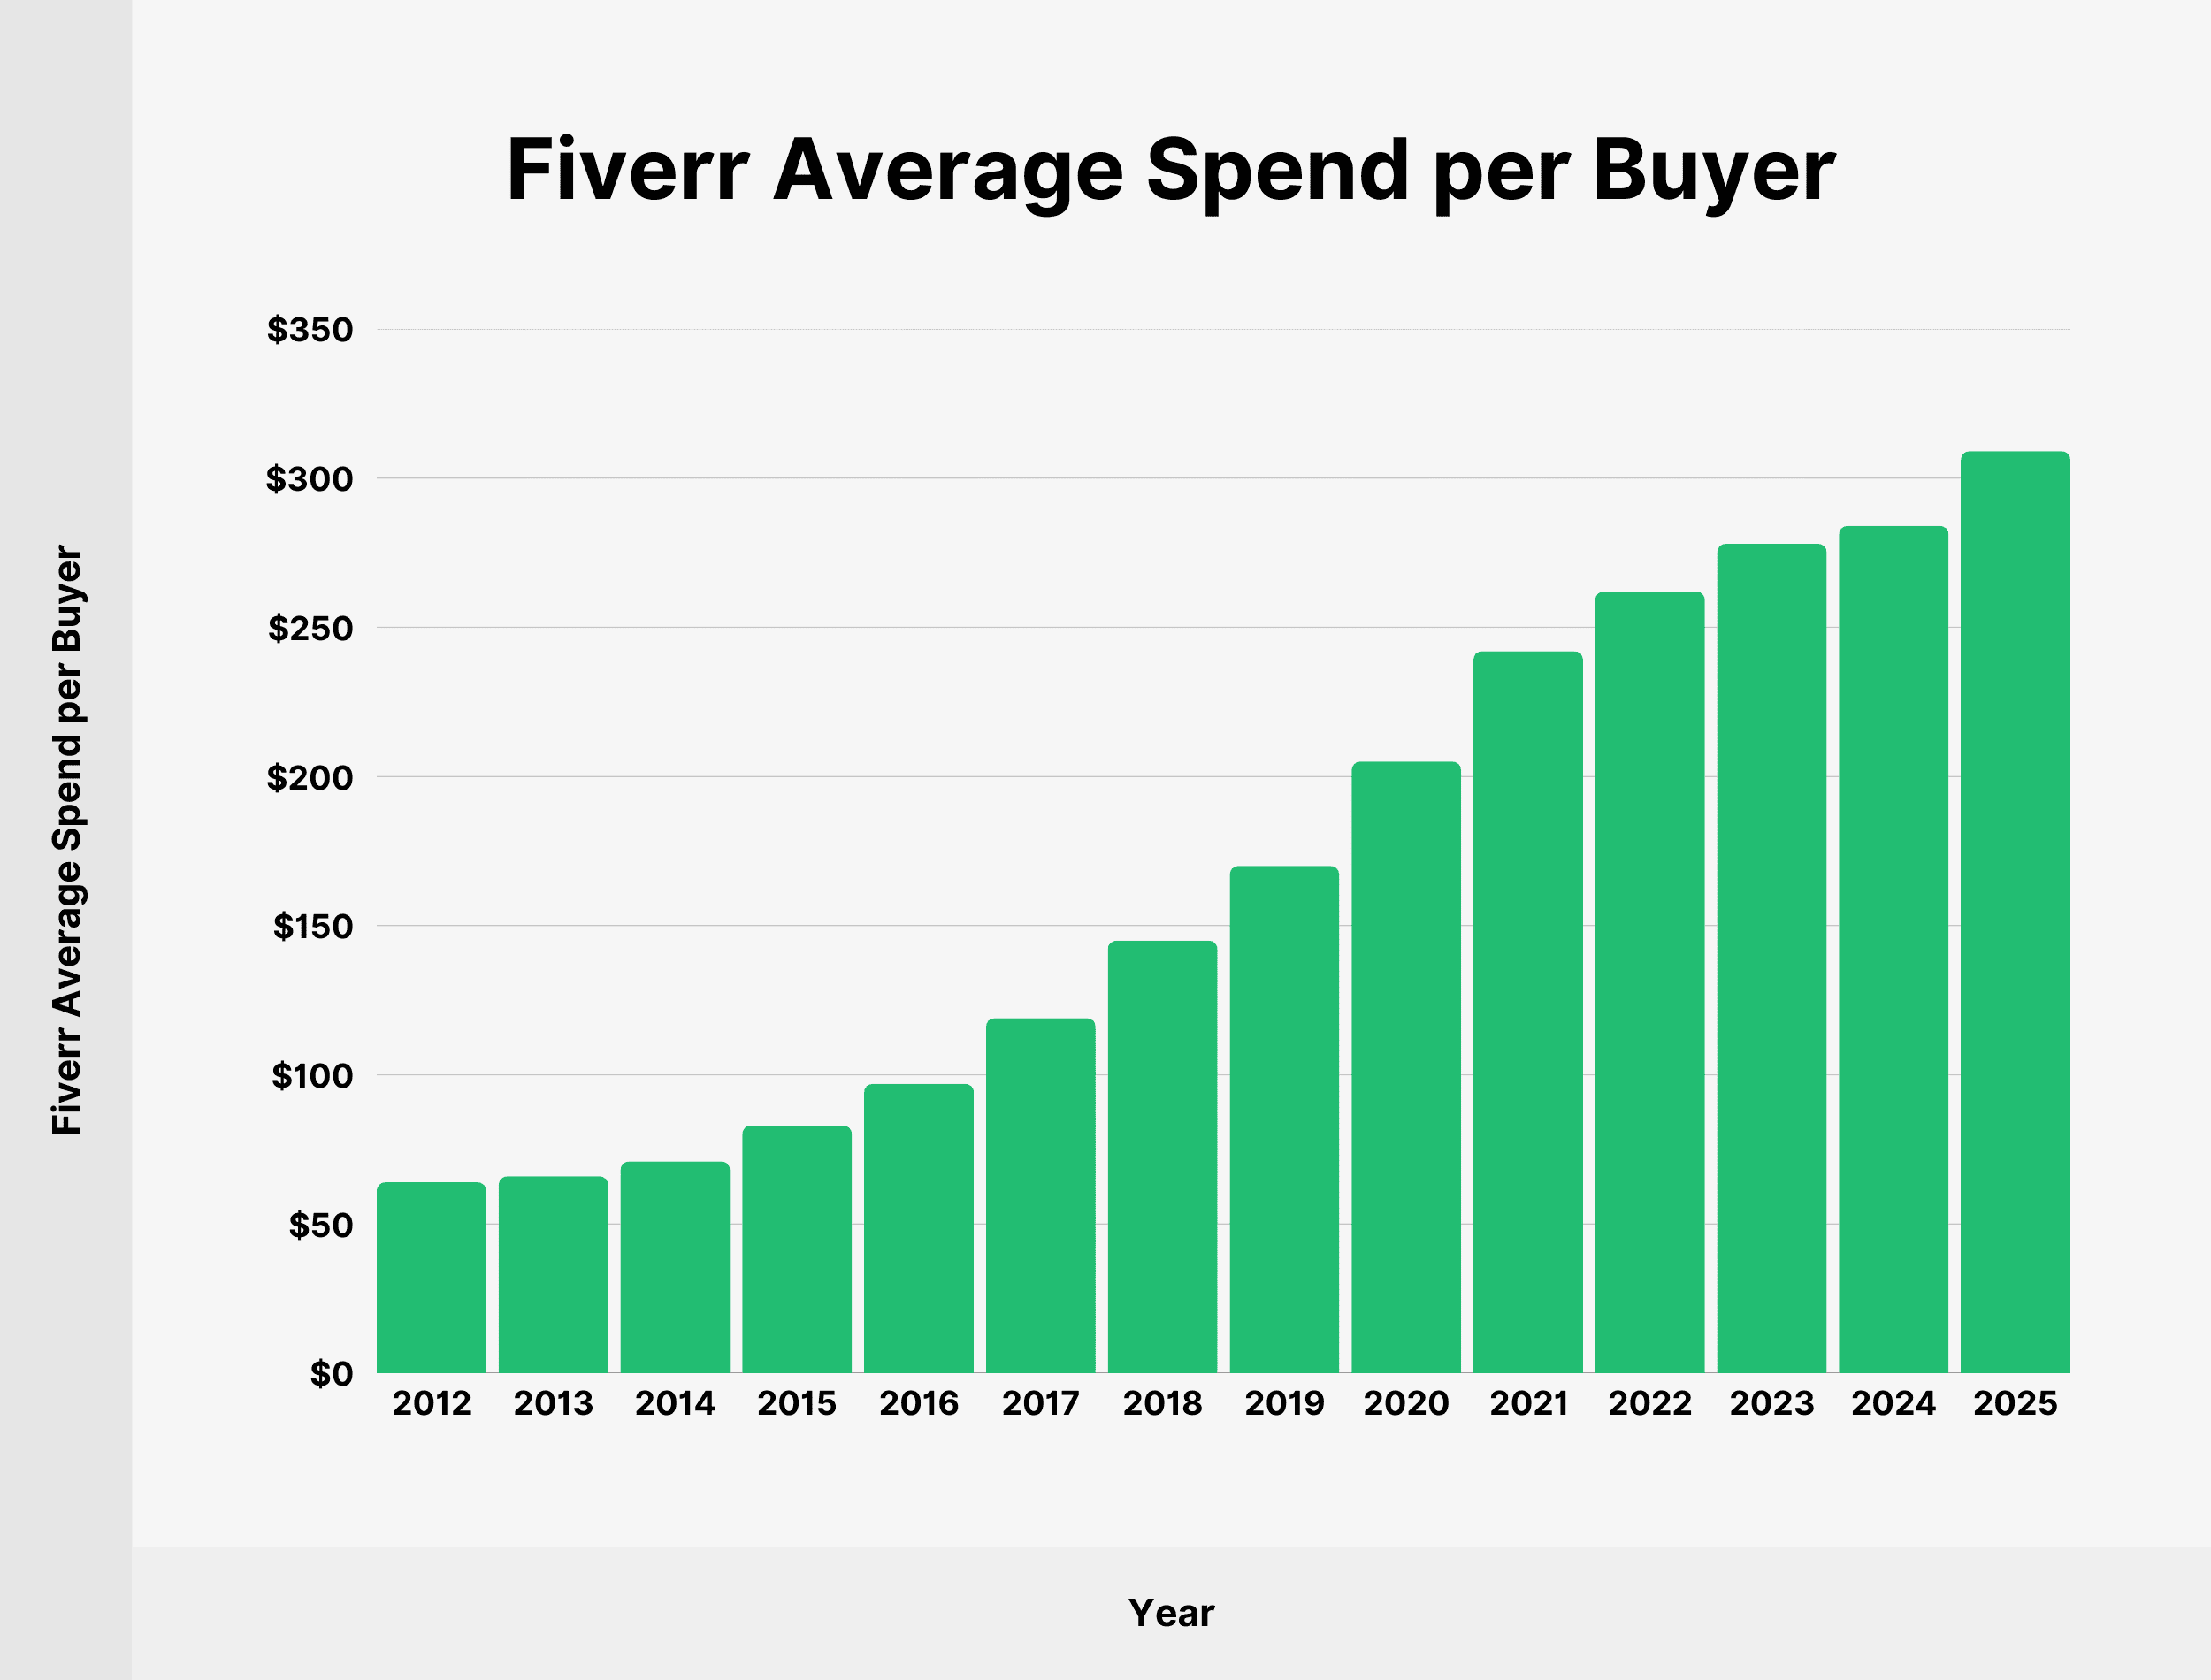
The average annual spend per buyer has been growing consistently since 2012:
| Year | Fiverr Average Spend per Buyer |
|---|---|
| 2012 | $64 |
| 2013 | $66 |
| 2014 | $71 |
| 2015 | $83 |
| 2016 | $97 |
| 2017 | $119 |
| 2018 | $145 |
| 2019 | $170 |
| 2020 | $205 |
| 2021 | $242 |
| 2022 | $262 |
| 2023 | $278 |
| 2024 | $284 |
| 2025 | $309 |
Buyers who spent over $500 contributed 64% of Fiverr’s core marketplace revenue in 2023.
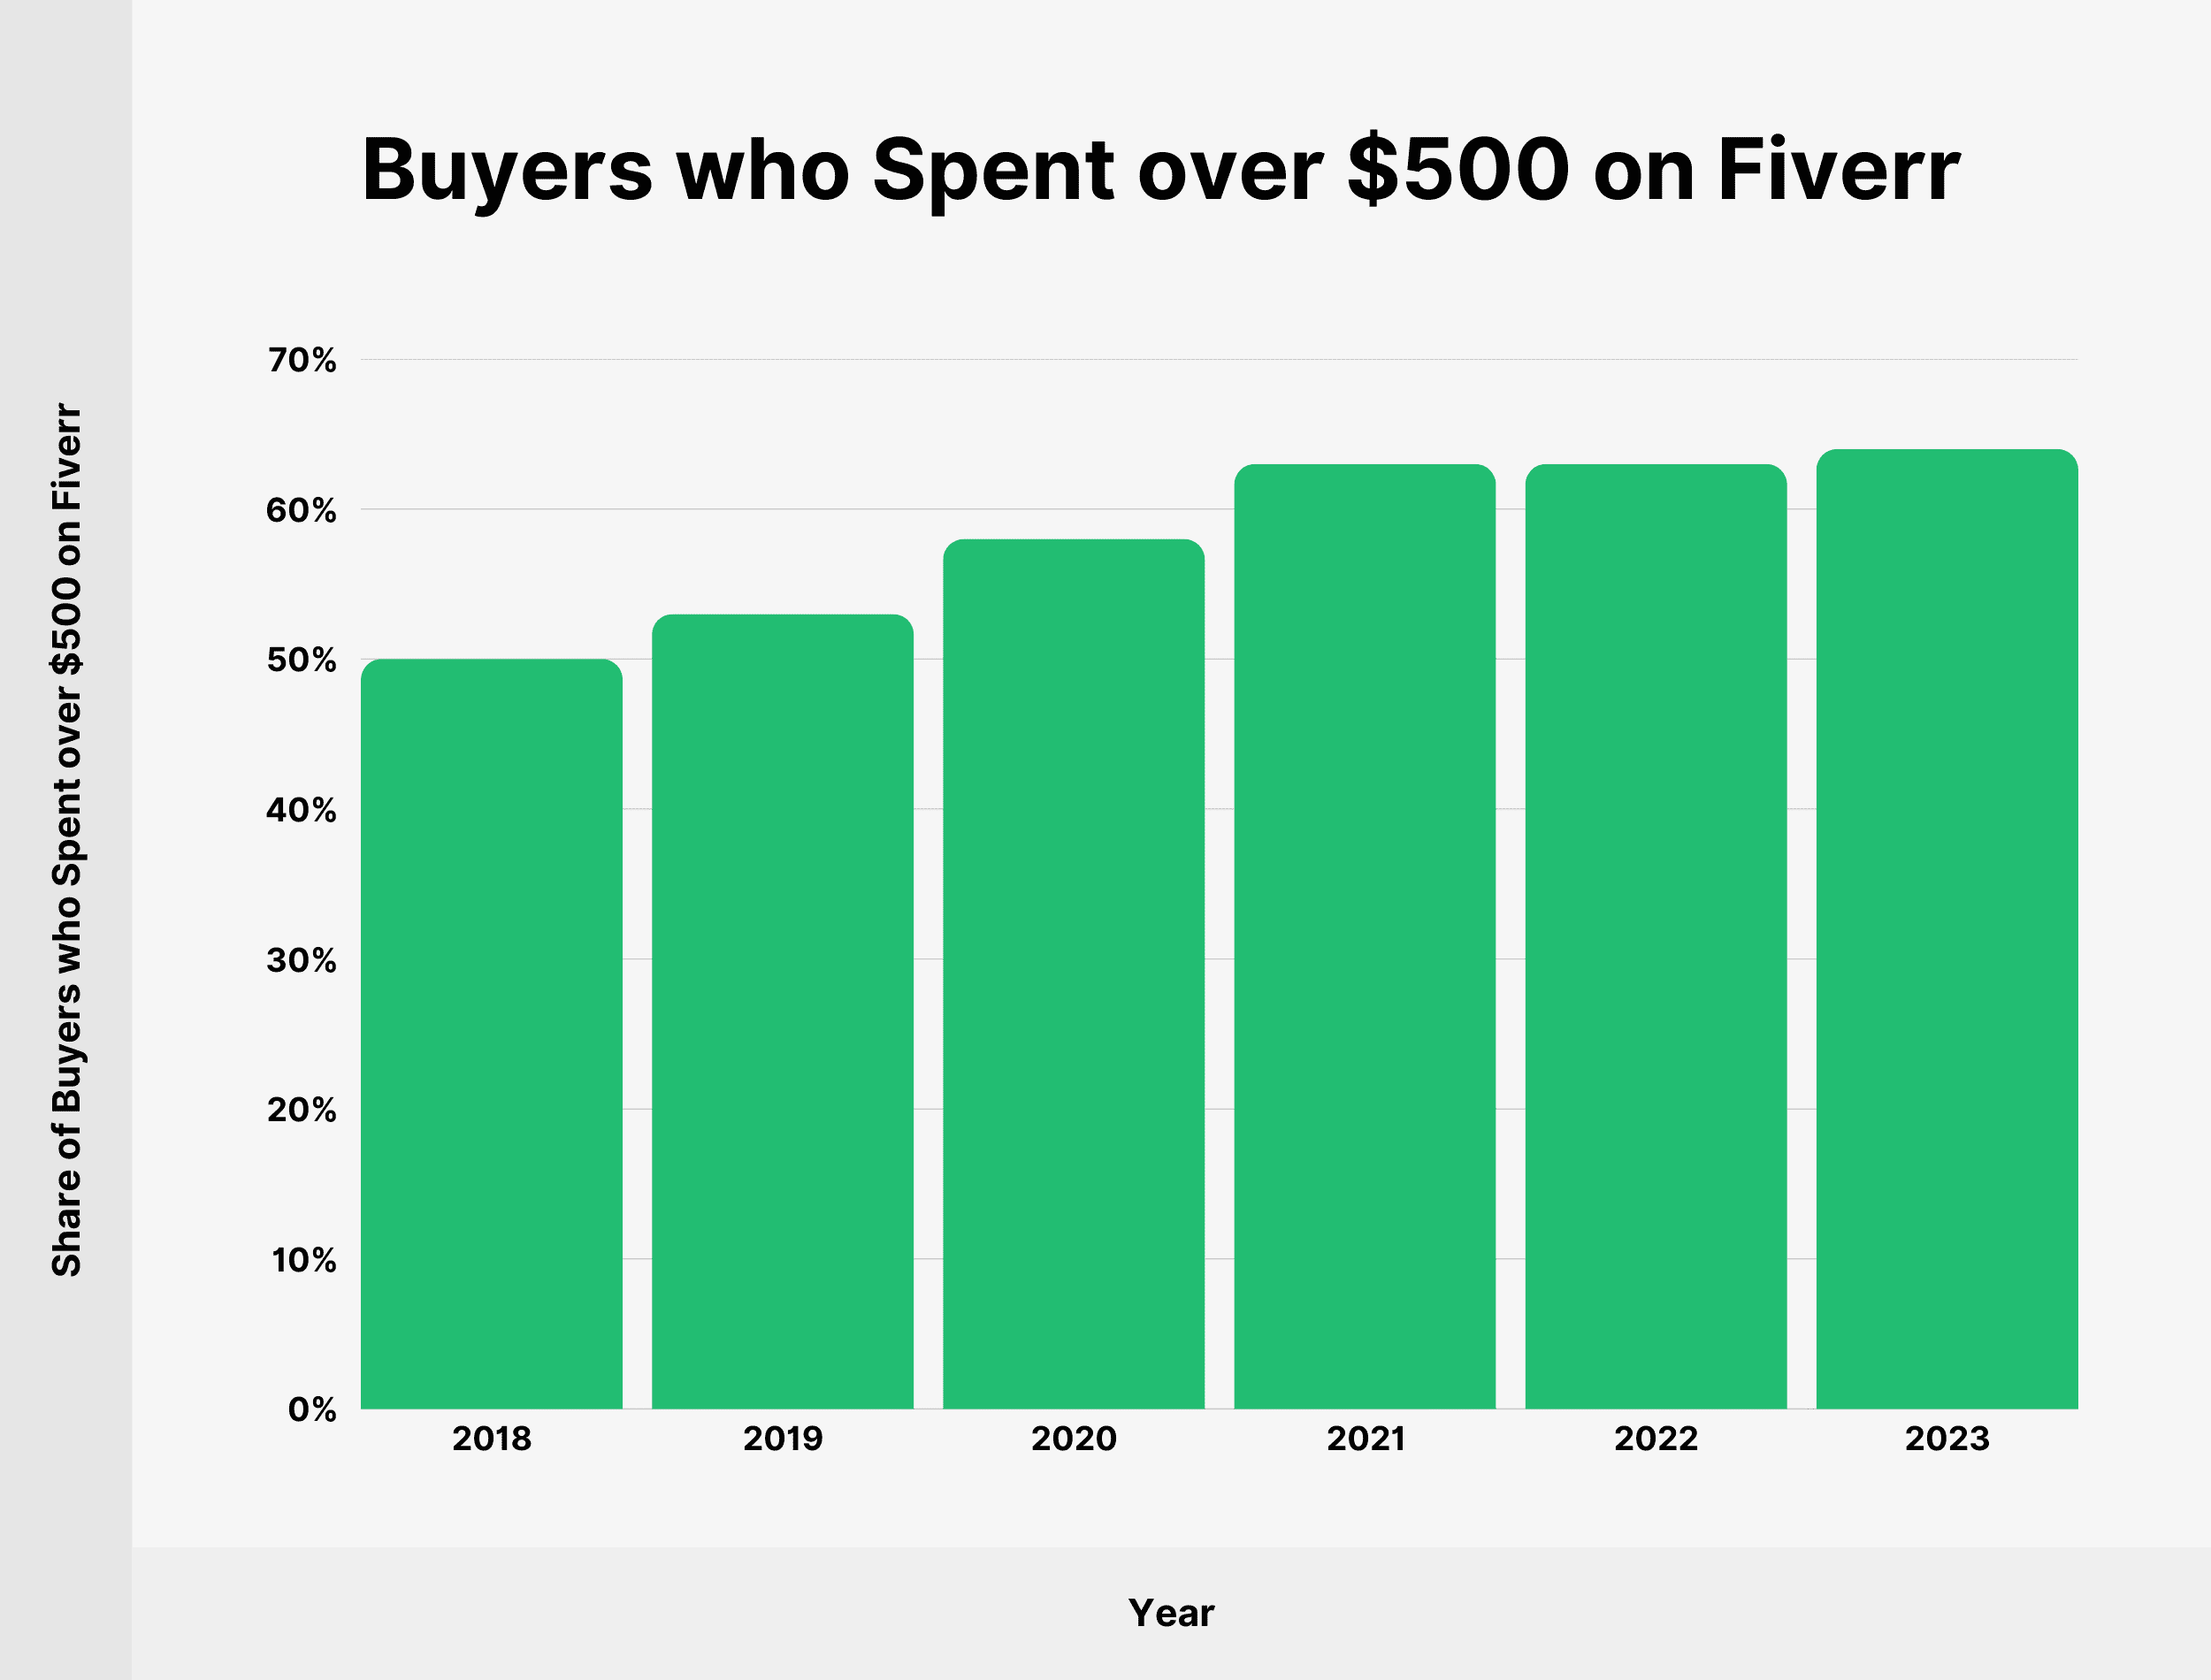
Accounts with an annual spend of $500+ have become increasingly significant to Fiverr’s total revenue:
| Year | Buyers who Spent over $500 on Fiverr (Share of Marketplace Revenue) |
|---|---|
| 2018 | 50% |
| 2019 | 53% |
| 2020 | 58% |
| 2021 | 63% |
| 2022 | 63% |
| 2023 | 64% |
Source: Fiverr
Fiverr Take Rate
Fiverr defines its take rate as a revenue percentage of gross merchandise volume.
Fiverr has a 32.3% take rate. That’s up from 31.8% in 2023.
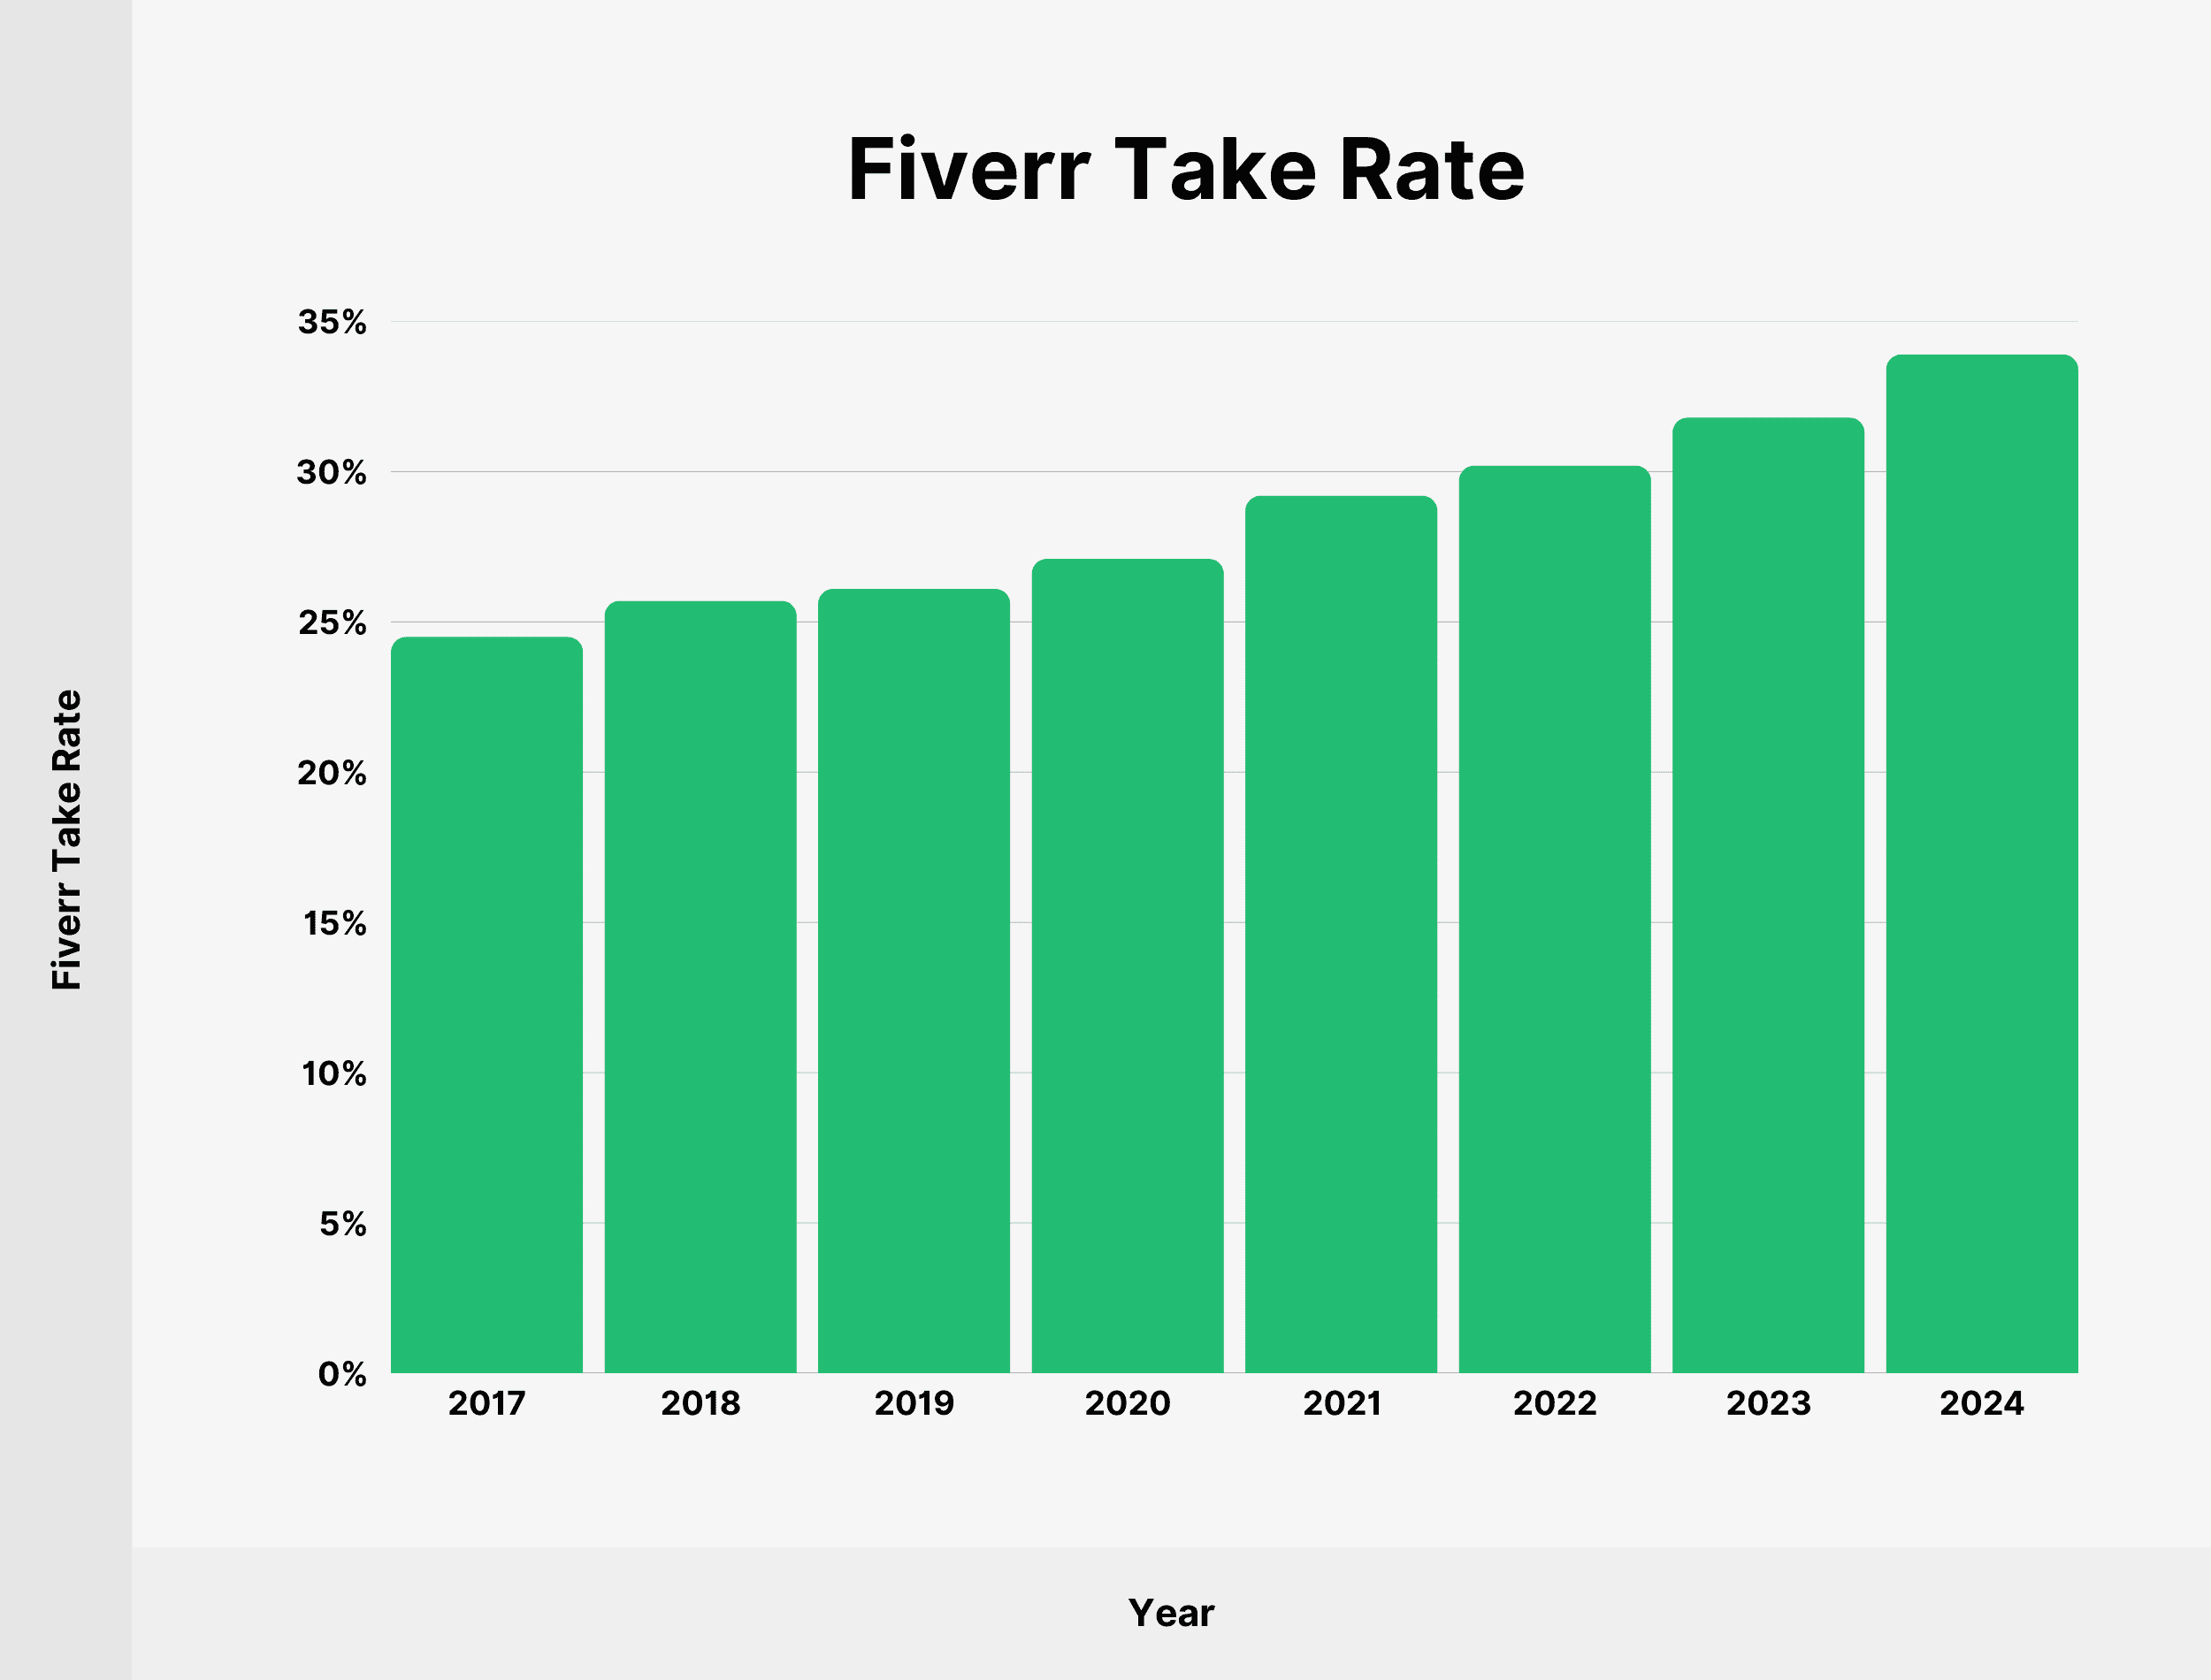
Here’s a table showing Fiverr’s take rate since 2017:
| Year | Fiverr Take Rate |
|---|---|
| 2017 | 24.5% |
| 2018 | 25.7% |
| 2019 | 26.1% |
| 2020 | 27.1% |
| 2021 | 29.2% |
| 2022 | 30.2% |
| 2023 | 31.8% |
| 2024 | 33.9% |
Source: Fiverr
Fiverr Net Promoter Score
Net Promoter Score is a customer index reflecting the likelihood that a user would recommend a service. It is scored out of 100.
Fiverr reports a score of 64 from buyers and 79 from sellers.

Source: Fiverr
How Many Categories Are Available on Fiverr?
The catalog of services on Fiverr includes over 700 categories across 10 verticals.

The platform has added 150 new categories since 2021. When the service was launched in 2010, it had just 8 categories.
Source: Fiverr
How Many People Work at Fiverr?
In 2024, Fiverr had 762 employees worldwide.
Here’s a table showing the number of employees at Fiverr since March 2019:
| Year | Fiverr Employees |
|---|---|
| March 2019 | 363 |
| December 2019 | 419 |
| December 2020 | 545 |
| December 2021 | 787 |
| December 2022 | 739 |
| December 2023 | 775 |
| December 2024 | 762 |
The most recent data shows that 332 Fiverr employees work in research and development.
Here’s a complete breakdown of Fiverr employees by department:
| Department | Fiverr Employees |
|---|---|
| Research and Development | 332 |
| Marketing | 204 |
| General and Administration | 111 |
| Customer Care | 128 |
Source: Fiverr
Conclusion
That’s all for our list of Fiverr stats in 2026.
With a gross merchandise value of over $1 billion, Fiverr is one of the leading freelancing marketplaces. I’ve done my best to provide you with the latest stats on Fiverr to help you better understand their growth story.
Backlinko is owned by Semrush. We’re still obsessed with bringing you world-class SEO insights, backed by hands-on experience. Unless otherwise noted, this content was written by either an employee or paid contractor of Semrush Inc.

