60+ Amazing Facebook Ads Stats (Updated)
In this list of Facebook ad statistics, you’ll learn about:
- How Facebook ads perform
- How much Facebook ads tend to cost
- Video ads on Facebook
- Forecasts and trends
- Lots more
So if you want an up-to-date list of Facebook advertising stats, you’ll love the data that we put together on this page.
01.Facebook Ads Performance
Our first set of Facebook ad stats is all about performance. Specifically, we cover what the typical CTR, CPC, and other key metrics any advertiser would want to know. We also share some data on which types of ads are working best right now on Facebook.
- 54% of surveyed marketers say that Facebook ads are “very effective” in generating sales. Only 8% claim they’re not effective (Databox)

- 29% of marketers claim use of Facebook resulted in the biggest ROI for their organization, more than any other social media platform (HubSpot)
- 67.55% of Facebook advertisers say videos drive more ad clicks on the platform compared to other content types (Databox)
- For 42.9% of surveyed marketers, the ideal audience size for Facebook ads is over 50,000 users (Databox)
- A Databox study found that across all industries, the average click-through rate (CTR) on Facebook Ads is 1.44% (Databox)
- The median cost-per-click (CPC) on Facebook Ads is $0.54 (Databox)

- As of Q2 2025, cost per mille (CPM) on Facebook Ads decreased by 5% year over year (Tinuiti)
- A recent analysis found that the average cost per mille (CPM) on Facebook Ads is $1.12 (Metricool)
- The average cost per mille (CPM) on Facebook Ads in the US reached $4.29 in 2024 (3.83x more than the global average) (Metricool)
- Facebook’s US ad revenue is estimated to reach $32.55 billion in 2024, showing a 7.2% year-over-year growth (eMarketer)

- Metricool analysis found that App Promotion campaigns on Facebook Ads had the highest cost per click – $0.32, whereas the lowest cost per click at $0.04 had Traffic campaigns (Metricool)
- The same Metricool study found that the average cost per mille (CPM) on Facebook ads with the Leads campaign is $3.36 (Metricool)
- Analysis of 675 B2C companies found that the median return on ad spend (ROAS) for Facebook Ads is 1.79 (Databox)
- Data from 636 B2C companies show the median return on ad spend (ROAS) for Facebook Ads is 1.8, nearly identical to B2C values (Databox)
- Wordstream study found that the average cost-per-action is $19.68 on Facebook Ads (Wordstream)

- Across all industries, the average Facebook Ads conversion rate is 8.95% and ranges between 3.95% and 11.34% depending on the industry (Wordstream)
- When it comes to lead ads on Facebook, the average cost per lead across various industries amounts to $23.10 (Wordstream)
- Cost per lead on Facebook ads is the most expensive among businesses in the legal services industry at $78.26, and the cheapest for organizations in real estate at $12.43 (Wordstream)
02.Facebook Demographic Statistics
As any marketer will tell you, the key to success on Facebook ads isn’t copy or bidding strategy. It’s targeting. This is why we dedicate an entire section of this list of Facebook ad stats to understanding who uses Facebook in the first place.
- 56.7% of Facebook users are men, compared to 43.3% of users who are women (Statista)
- India, which has the largest user base by country, makes up roughly 17.3% of Facebook’s advertising audience. The US, coming in second place, accounts for an 8.39% share of the Facebook ad audience (DataReportal)
- 32% of teenagers use Facebook, which puts its usage among that group behind YouTube, TikTok, Instagram, and Snapchat (Pew Research Center)
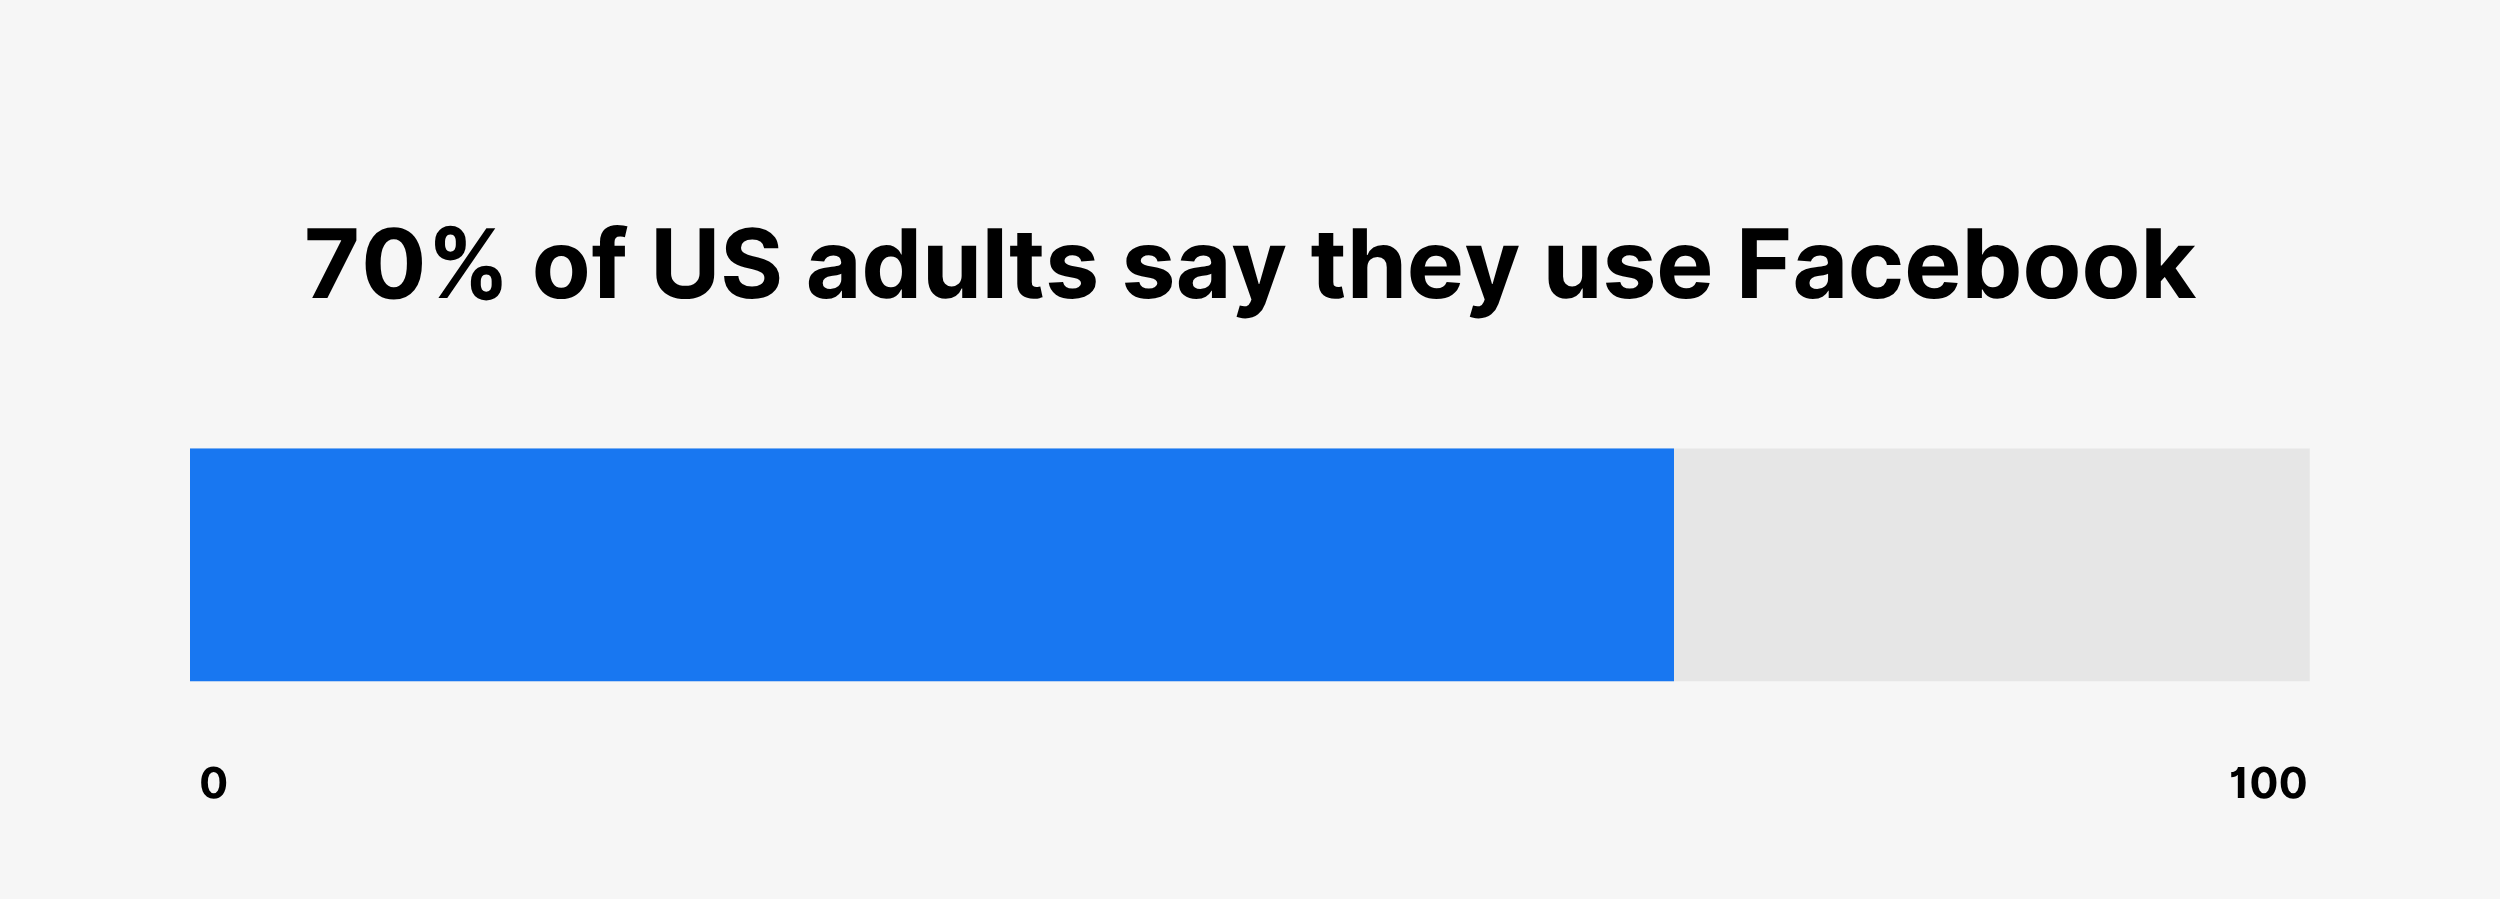
- 70% of US adults say they use Facebook (Pew Research Center)
- 78% of adult women on the internet use Facebook versus 61% of men (Pew Research Center)
- 70% of people in the US who have graduated from college use Facebook, among Americans with a high school degree or less, that’s 69% (Pew Research Center)
- 67% of urban-dwelling adults use Facebook, compared to 74% of people living in rural areas (Pew Research Center)
- The age group with the highest percentage of Facebook users worldwide is the 25-34-year-old segment (31.2%), followed by people ages 18-24 (21.8%) (Statista)
- In the US, nearly 1 in 4 (24.2%) Facebook users are between 25 and 34 years old, followed by the age group of 18-24, accounting for 18.6% of the total Facebook user base (Statista)
03.Facebook Ads Best Practices
If you’re running Facebook ads, you might be wondering how to get the most out of them. Fortunately, you don’t need to guess. Lots of industry studies (including a few done by Facebook) have revealed data-driven Facebook marketing best practices.
- Facebook recommends making the image size on feed ads at least 1080 x 1080 pixels (Facebook)
- Facebook suggests keeping approximately 14% of the top, 35% of the bottom, and 6% on each side of the video for Facebook Reels free of text, logos, or any other visual elements (Facebook)
- After analyzing 752,626 Facebook ads, AdEspresso found that the median length of the headline is 5 words (AdEspresso)

- The same AdEspresso analysis found that the average ad text contains 19 words (AdEspresso)
- The top 5 most commonly used call-to-action buttons on Facebook ads are Learn More, Contact Us, Sign Up, Call Now, and Download (Databox)
04.Facebook Messenger Statistics
Facebook Messenger is becoming more and more mainstream. And social media marketers are taking notice. Specifically, they’re using Chatbots to keep in touch with their target audience on Messenger. Let’s see what the stats have to say about this emerging area of social media marketing.
- Facebook Messenger has 947 million active users (Statista)
- Around 194.8 million people use Facebook Messenger in the US (Statista)
- Nearly half (44%) of Facebook Messenger users in the US are those aged 25 to 44 (Statista)
- Facebook Messenger had 302.09 million downloads worldwide in 2024, down from 262.53 million in 2023 (Statista)
- Facebook Messenger holds the title of the most recognized messenger service among internet users in the US, with 91% aware of it (Statista)
- More than 1 billion users connect with a business account across Meta-owned messaging services, including Messenger (Meta)
05.Facebook Video Statistics
You’ve probably noticed more and more video ads in your Facebook feed. There’s a good reason for that: video is a super powerful medium that helps your ad stand out from the baby pictures that dominate most feeds. And while video posts can get a higher organic reach compared to text-based posts, there’s evidence to support using video as part of your Facebook ad campaigns too.
- Video accounts for more than 60% of time spent on Facebook (Meta)

- A survey conducted among holiday shoppers worldwide found that 55% considered online videos to be a useful tool for discovering gift ideas (Meta)
- According to the analysis of 12 million ad sets on Facebook, vertical videos with audio achieved a 12% higher conversion rate compared to other video types (Meta)
- Vertical video with audio as Reels ads had a 35% higher click-through rate (CTR) compared to other Reels ads (Meta)

- Mobile-friendly (under 15 seconds or vertical) video ads on Facebook had a 12.3% lower cost per conversion compared to non-mobile optimized video ads (Meta)
06.Facebook Benchmarks & Trends
These Facebook statistics are focused on how users consume content on Facebook. And how they interact with ads. We also share some interesting stats about how Facebook ads compare to other ads on search and other social networks.
- As of Q2 2024, Facebook reported having 3.48 billion daily active users (Meta)
- As of Q4 2023, Facebook reported having 3.07 billion active monthly users (Meta)
- Facebook’s US ad revenue is estimated to reach $32.55 billion in 2024 (eMarketer)
- Facebook is the second most widely used online platform, behind only YouTube (Pew Research Center)
- Facebook is the most popular social media channel for marketing (HubSpot)

- 84% of B2C marketers who used paid social advertising in the past 12 months used Facebook, more than any other platform (Content Marketing Institute)
- In a survey of B2C marketers, 88% of respondents say Facebook ads are at least “somewhat effective” (Content Marketing Institute)
- 29% of B2B content marketers say that Facebook delivers the best value for their organization, only behind LinkedIn with 84% share (Content Marketing Institute)
- Facebook ads reach an estimated .36 billion people globally (DataReportal)
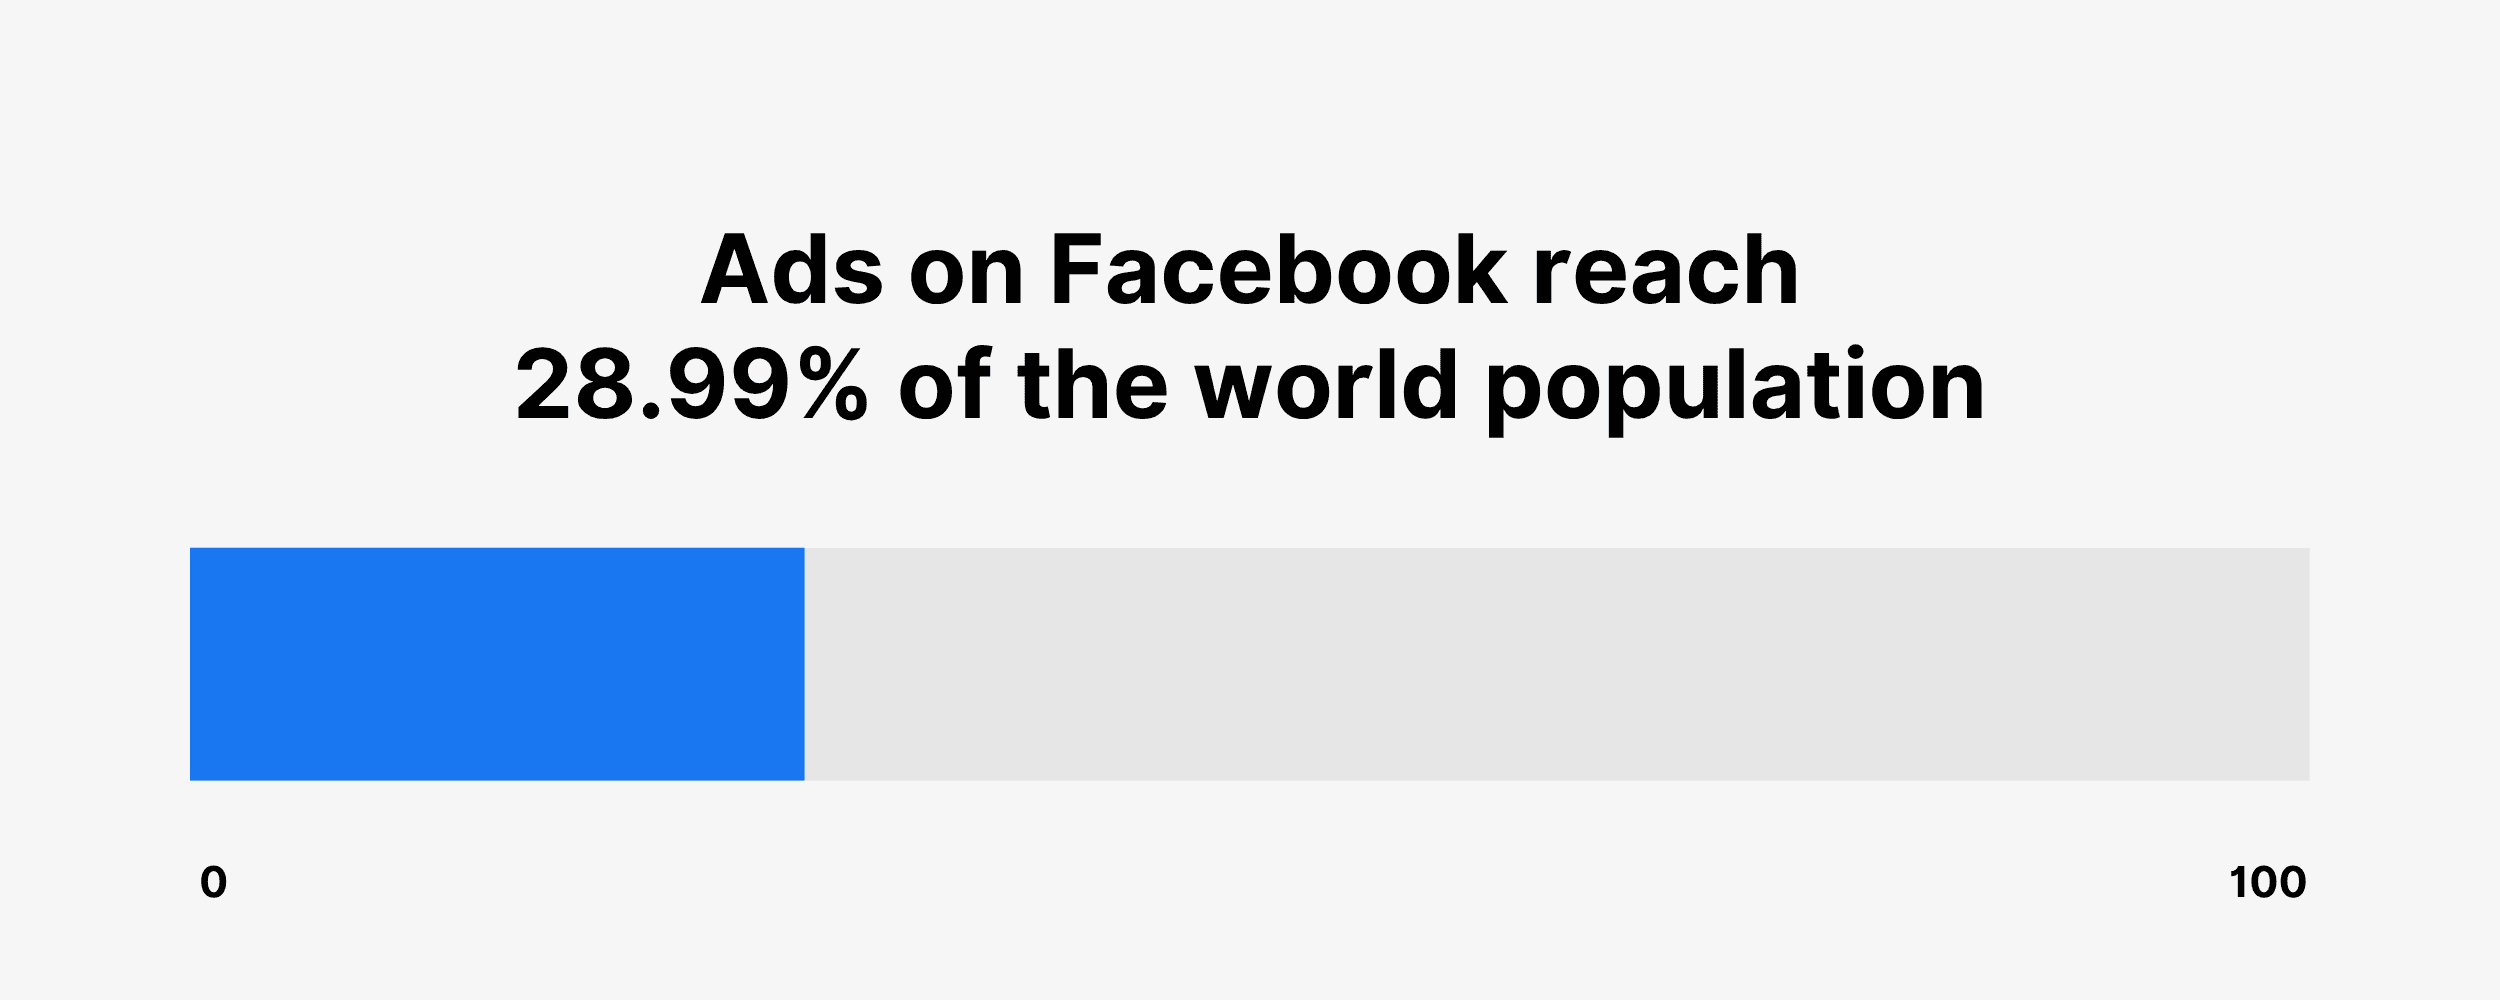
- Ads on Facebook reach 28.99% of the world population (DataReportal)
- 49.2% of Facebook advertisers monitor their ad campaign performance daily (Databox)
- Ecommerce businesses typically spend less than $2,500 per month on Facebook ads (Databox)
07.Facebook User Behavior Statistics
We just covered a bunch of stats that show how many people use Facebook. The question is: now that they’re on Facebook, how do they use it? What devices are they on? Let’s find out.
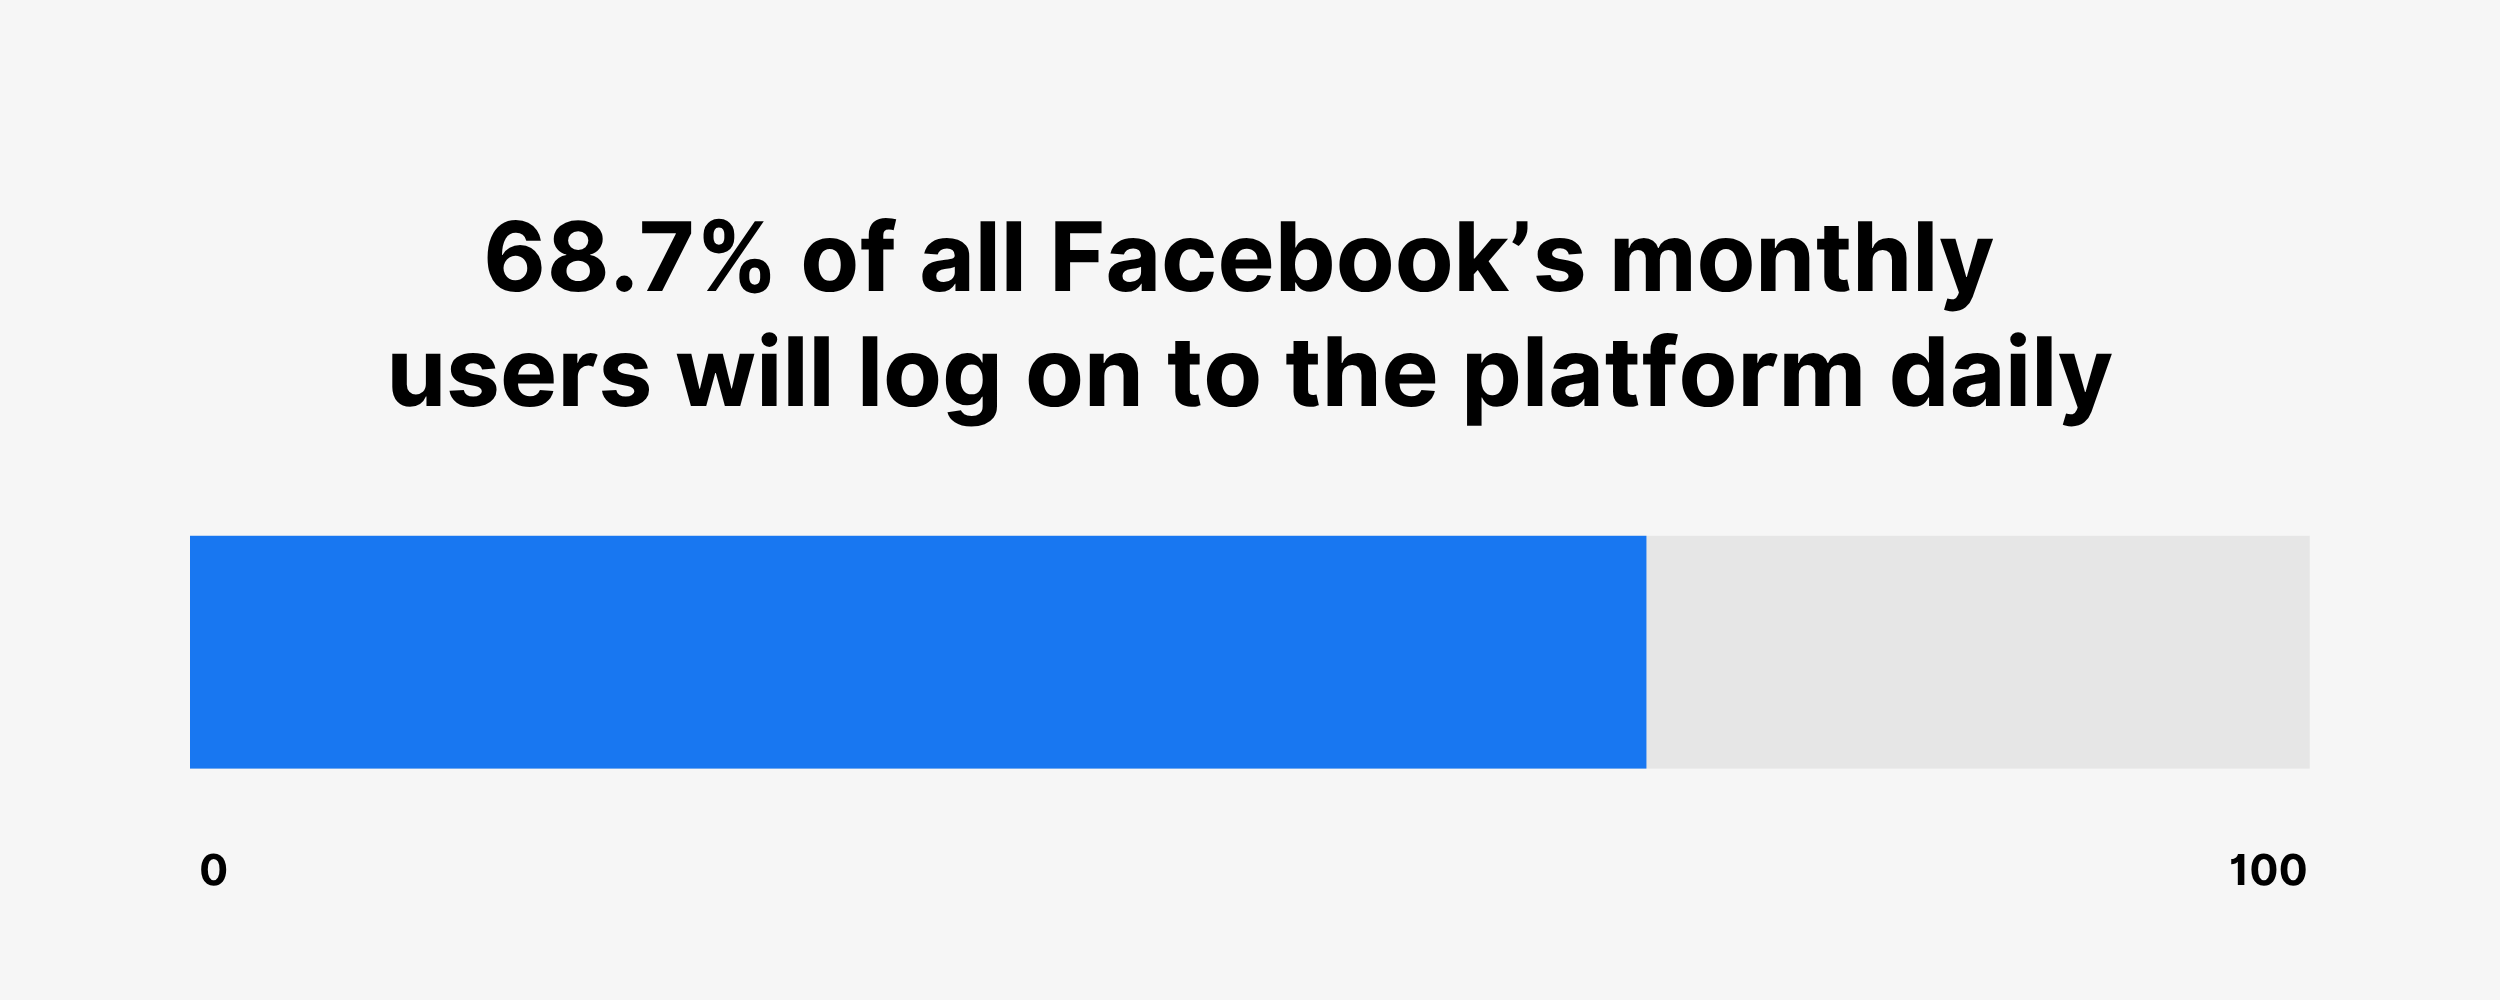
- 68.7% of all Facebook’s monthly users will log on to the platform daily (Meta)
- The average daily time spent by US adults on Facebook is 30.9 minutes (eMarketer)
- On average, adults 55 to 64 years old in the US spend 45 minutes per day on Facebook; among those 18 to 24, that’s only 22 minutes a day (eMarketer)
- Only 2.6% of Facebook users access the platform exclusively through laptop or desktop computers (Statista)
08.Facebook Forecasts
Let’s take a look at some Facebook ad stats that are focused on the future.
- Facebook’s overall ad revenues are expected to reach $127 billion a year by 2027 (Statista)

- By the end of 2025, TikTok is forecasted to surpass Facebook in total time spent among US adults at 5.19 daily minutes vs. 5.02 billion minutes (eMarketer)
- Meta (including Facebook and Instagram) is projected to account for 40.7% of the total time spent on social video in the US in 2025 (eMarketer)
Conclusion
There you have it: our list of 60+ Facebook ad statistics.
Facebook Ads remain a powerful and adaptable tool for reaching targeted audiences and achieving marketing goals so make sure to check this list as we update it with new stats.
