DoorDash is the most popular food delivery app in the United States.
The company claims a 67% market share in the US and operates in over 30 countries.
Today, the food delivery platform has more than 42 million monthly active consumers and processed over $80 billion in gross order value in 2024.
Continue reading to find the latest stats on DoorDash:
- DoorDash Usage Statistics (Highlight Picks)
- DoorDash Customers
- DoorDash Subscribers
- DoorDash Merchants
- DoorDash Couriers
- DoorDash Total Orders
- DoorDash Marketplace GOV
- DoorDash Market Share in the US
- DoorDash Revenue
- DoorDash Operating Expenses
- DoorDash Employees
DoorDash Usage Statistics (Highlight Picks)
- DoorDash completed 2.6 billion orders in the first nine months of 2024.
- The food delivery brand processed more than $80 billion in gross order value in 2024.
- DoorDash brought in $10.72 billion in revenue in 2024 – a 24.07% annual increase.
- There are 8 million active couriers delivering orders for DoorDash from more than 600,000 merchants.
- More than 42 million consumers place orders on DoorDash marketplaces each month.
DoorDash Customers
DoorDash had more than 42 million monthly active users placing at least one order in December 2024. That’s up from 37 million in December 2023.

Note: Includes monthly active users of marketplaces owned by DoorDash Inc. – DoorDash and Wolt.
Source: DoorDash
DoorDash Subscribers
DoorDash offers a paid subscription service (DashPass), which offers free deliveries on eligible orders.
According to company data, DoorDash hit 22 million DashPass subscribers in Q4 2024.

According to an eMarketer survey, 12% of US adults are DashPass members as of June 2024, which is more than similar subscription services offered by Uber (7%) or Instacart (9%).
DoorDash Merchants
DoorDash has around 600,000 merchants. According to the company, 100,000 new merchants joined marketplaces owned by DoorDash in 2023 alone.

Sources: DoorDash, DoorDash (2)
DoorDash Couriers
DoorDash had more than 8 million delivery couriers (Dashers) in 2024. Total annual earnings reached over $18 billion in 2024.

Here’s a table with complete data on DoorDash couriers since 2021:
| Year | DoorDash Couriers | Annual Earnings |
|---|---|---|
| 2021 | 6 million | $11 billion |
| 2022 | 6 million | $13 billion |
| 2023 | 7 million | $15 billion |
| 2024 | 8 million | $18 billion |
Source: DoorDash
DoorDash Total Orders
DoorDash processed 2.6 billion orders in 2024, growing from a total of 2.161 billion in 2023.
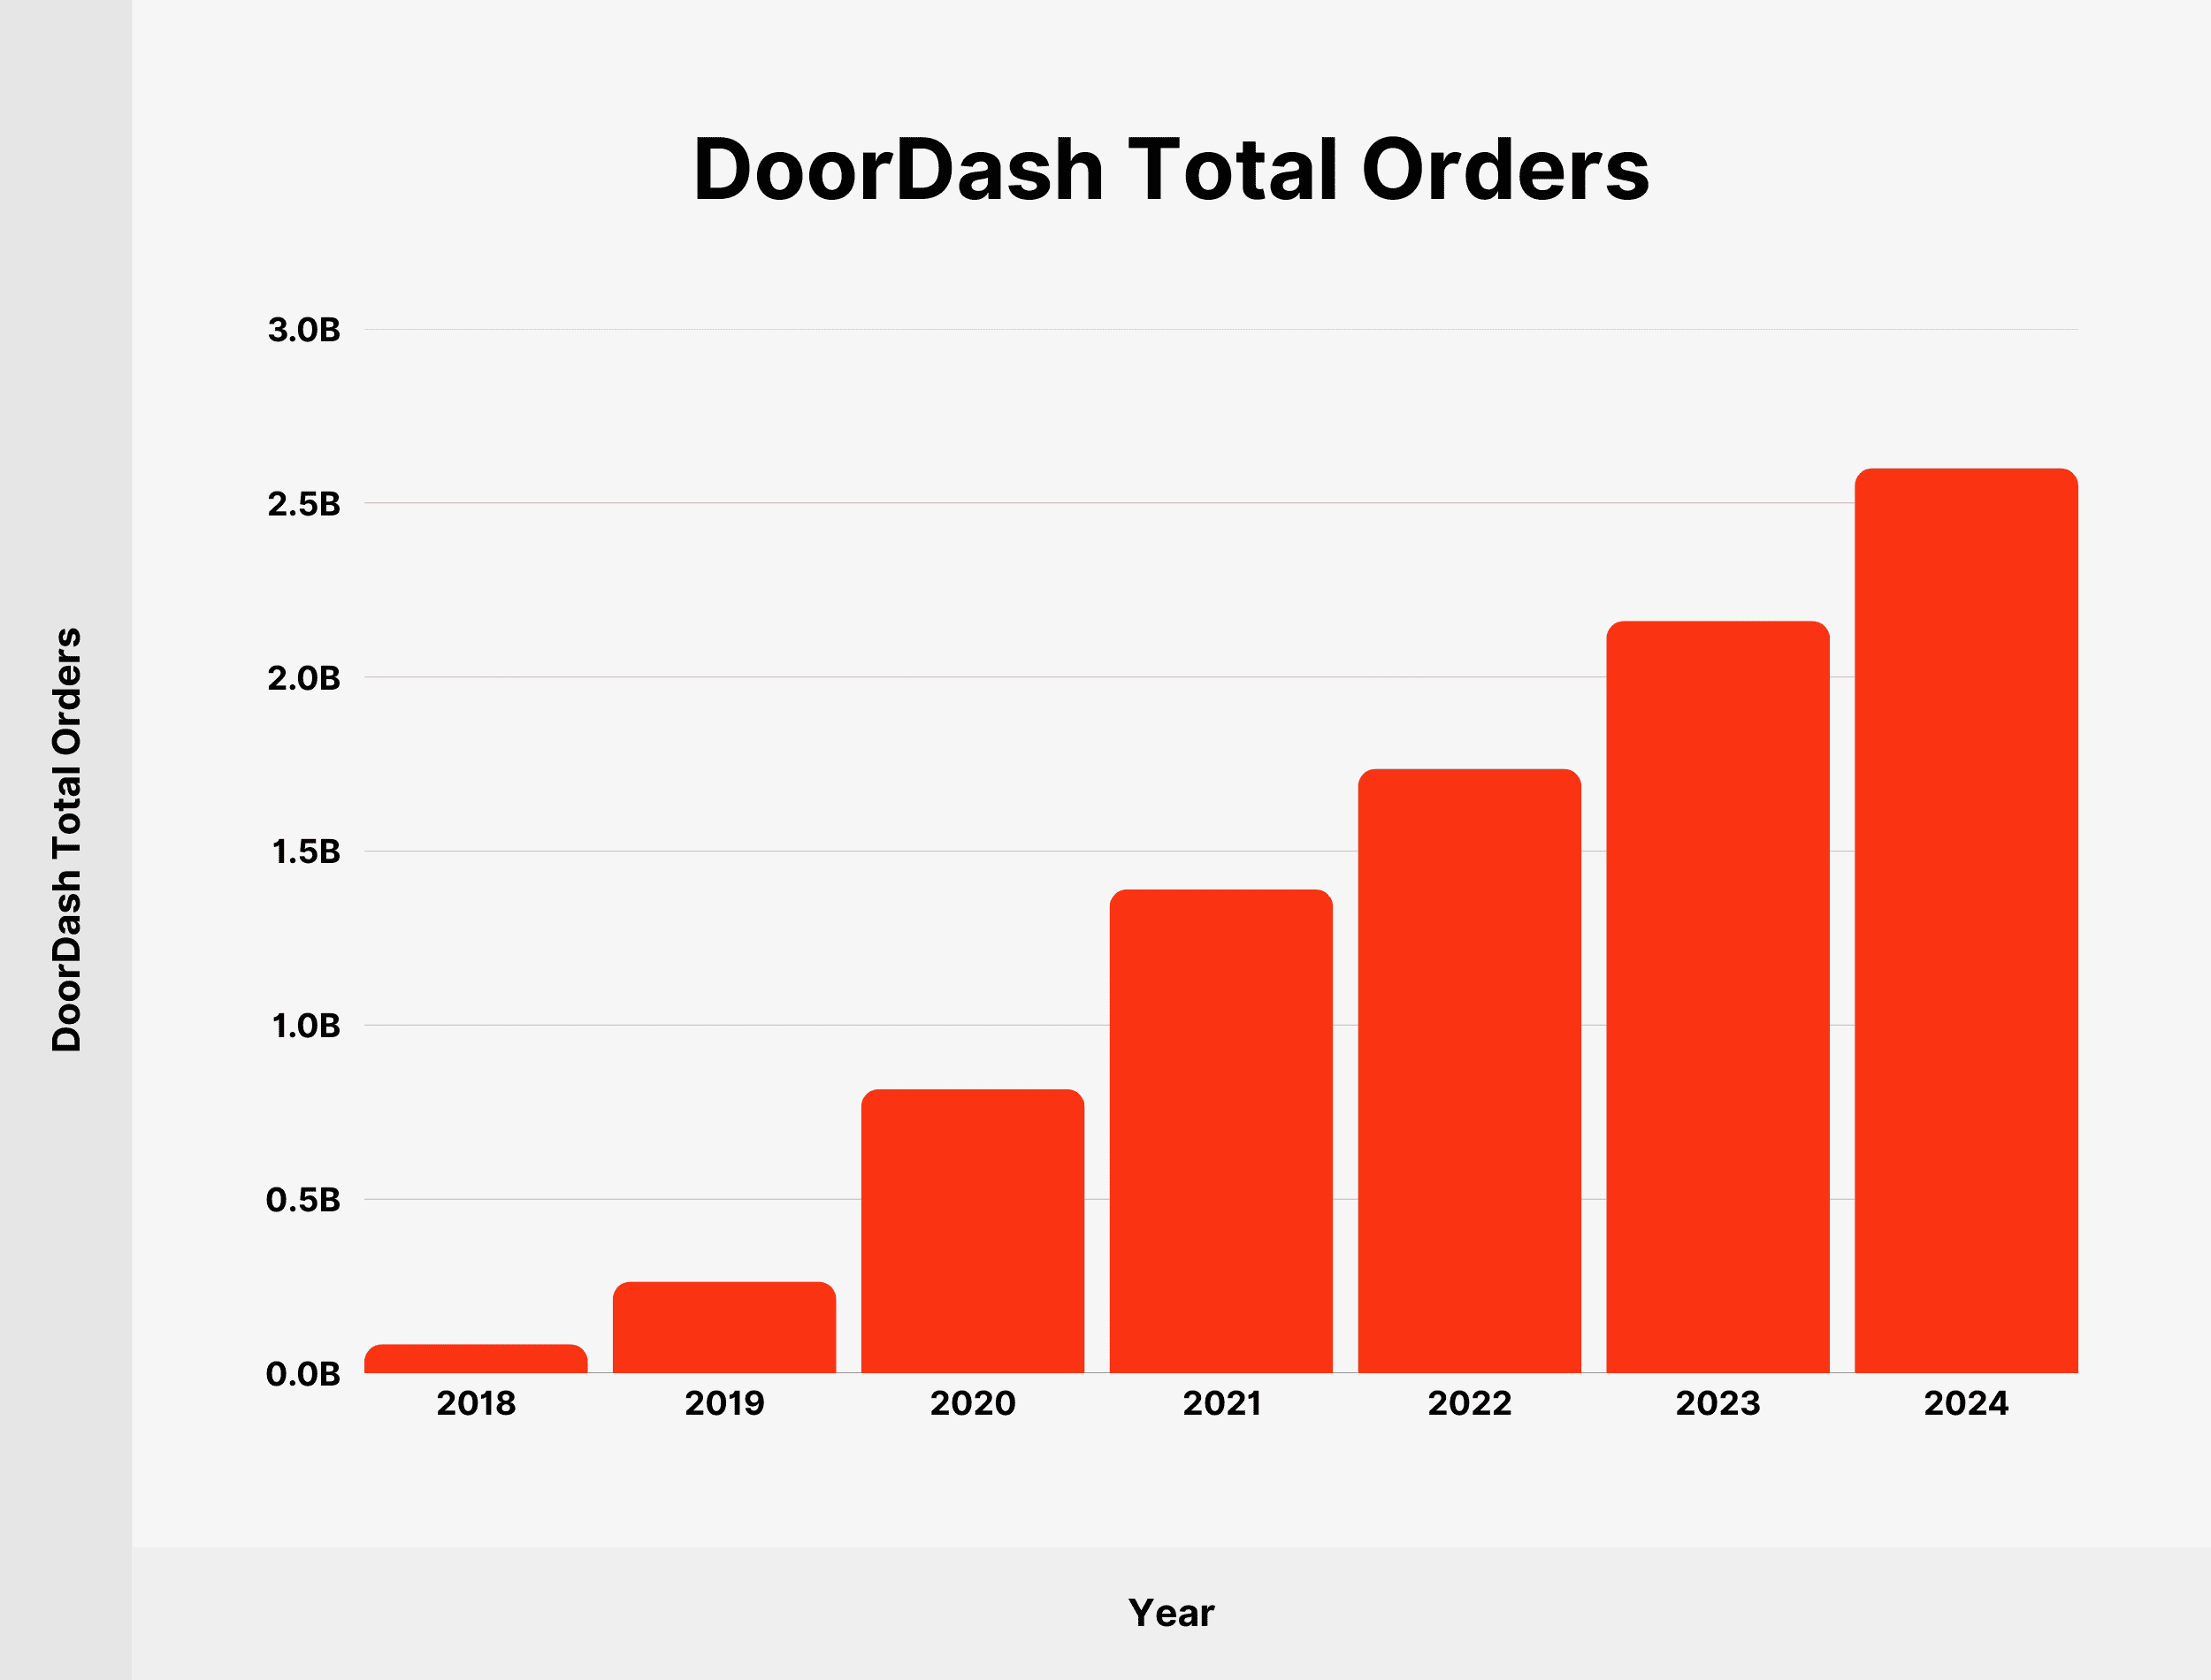
Here’s a table showing DoorDash’s total orders since 2018:
| Year | DoorDash Total Orders |
|---|---|
| 2018 | 83 million |
| 2019 | 263 million |
| 2020 | 816 million |
| 2021 | 1.39 billion |
| 2022 | 1.736 billion |
| 2023 | 2.161 billion |
| 2024 | 2.6 billion |
Source: DoorDash
DoorDash Marketplace GOV
DoorDash refers to the total value of completed orders as “marketplace gross order value”. This includes any applicable taxes, tips, membership fees, and other fees.
As such, DoorDash had $80.23 billion in marketplace gross order value in 2024 – an increase from the $66.77 billion processed orders on the platform in 2023.
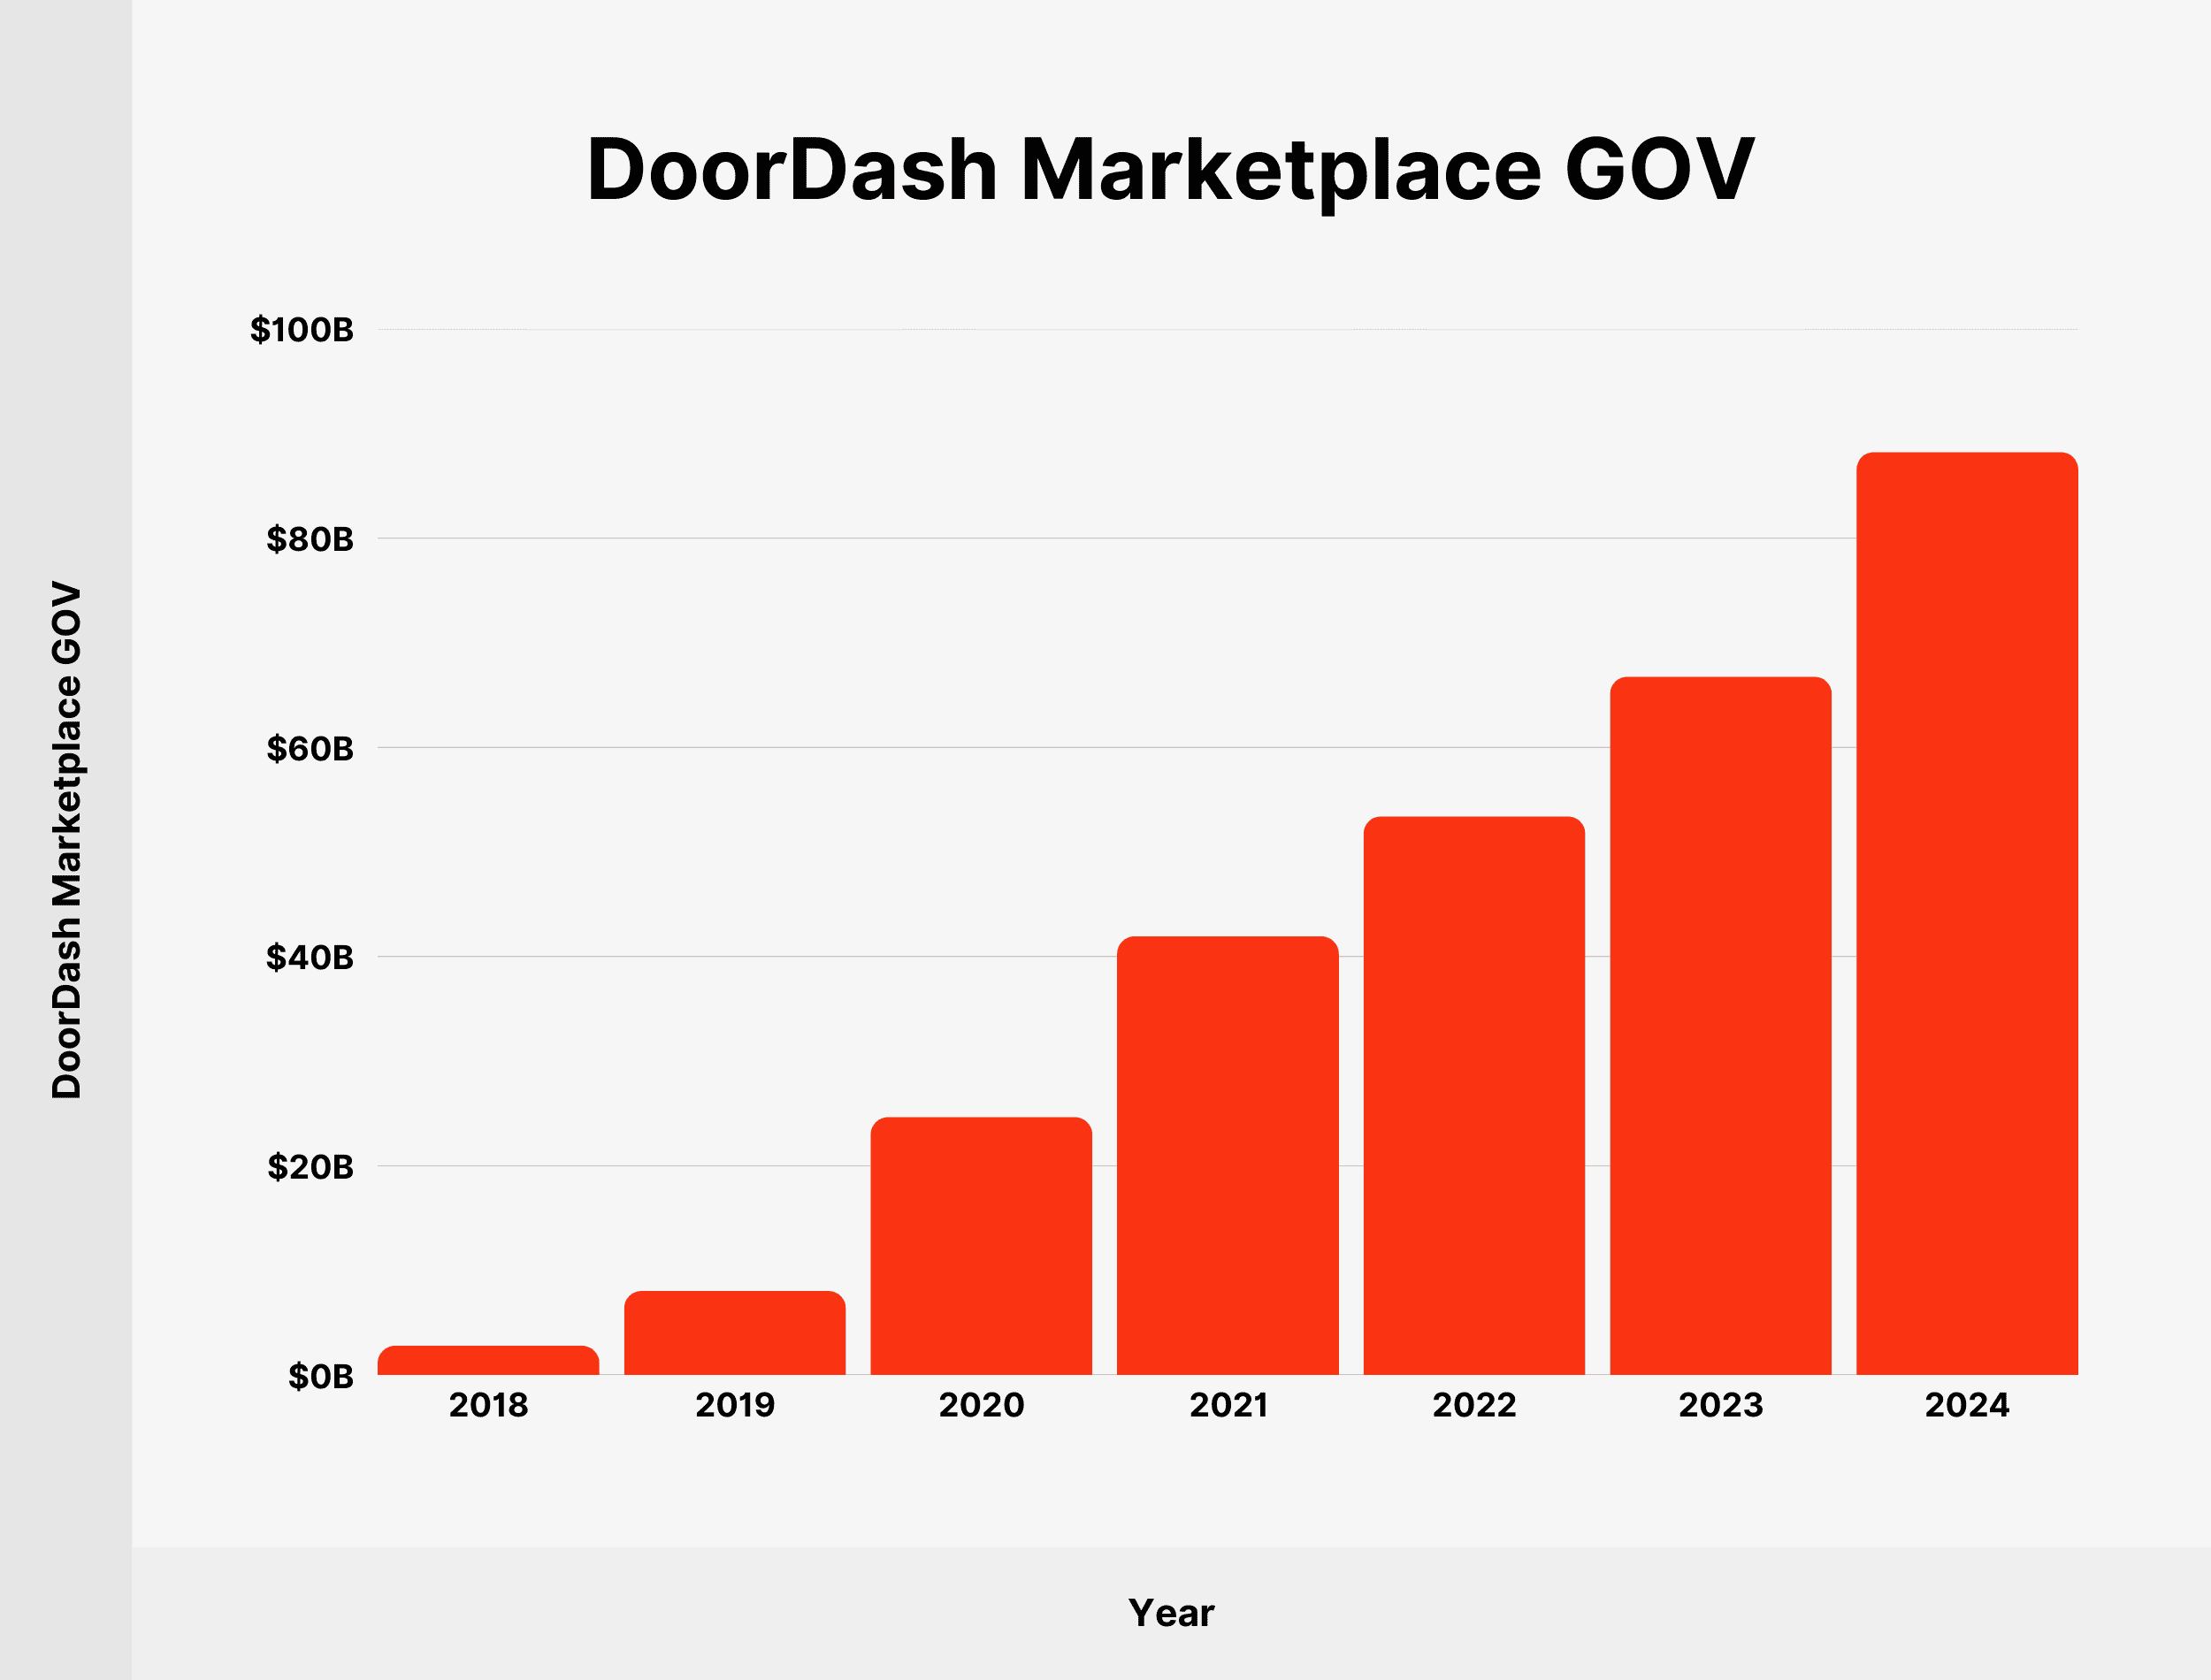
DoorDash’s annual marketplace gross order value increased by 225% in 2024 compared with 2020.
We’ve displayed DoorDash’s marketplace gross order value since 2018:
| Year | DoorDash Marketplace GOV |
|---|---|
| 2018 | $2.81 billion |
| 2019 | $8.04 billion |
| 2020 | $24.66 billion |
| 2021 | $41.94 billion |
| 2022 | $53.41 billion |
| 2023 | $66.77 billion |
| 2024 | $88.23 billion |
Source: DoorDash
DoorDash Market Share in the US
DoorDash claimed a 67% market share of US food delivery services in March 2024.

The company has shown consistent market share growth since July 2018. Back then, DoorDash’s share accounted for 18% of the US food delivery market.
Here’s a comprehensive overview of DoorDash’s market share in the US since July 2018:
| Date | DoorDash US Market Share |
|---|---|
| July 2018 | 18% |
| September 2019 | 35% |
| April 2020 | 45% |
| October 2020 | 48% |
| January 2021 | 53% |
| April 2021 | 56% |
| May 2021 | 57% |
| May 2022 | 59% |
| May 2023 | 65% |
| March 2024 | 67% |
Sources: Second Measure, Edison Trends, Bloomberg
DoorDash Revenue
DoorDash generated $10.72 billion in revenue in 2024. And brought in $8.64 billion in the first nine months of 2023.
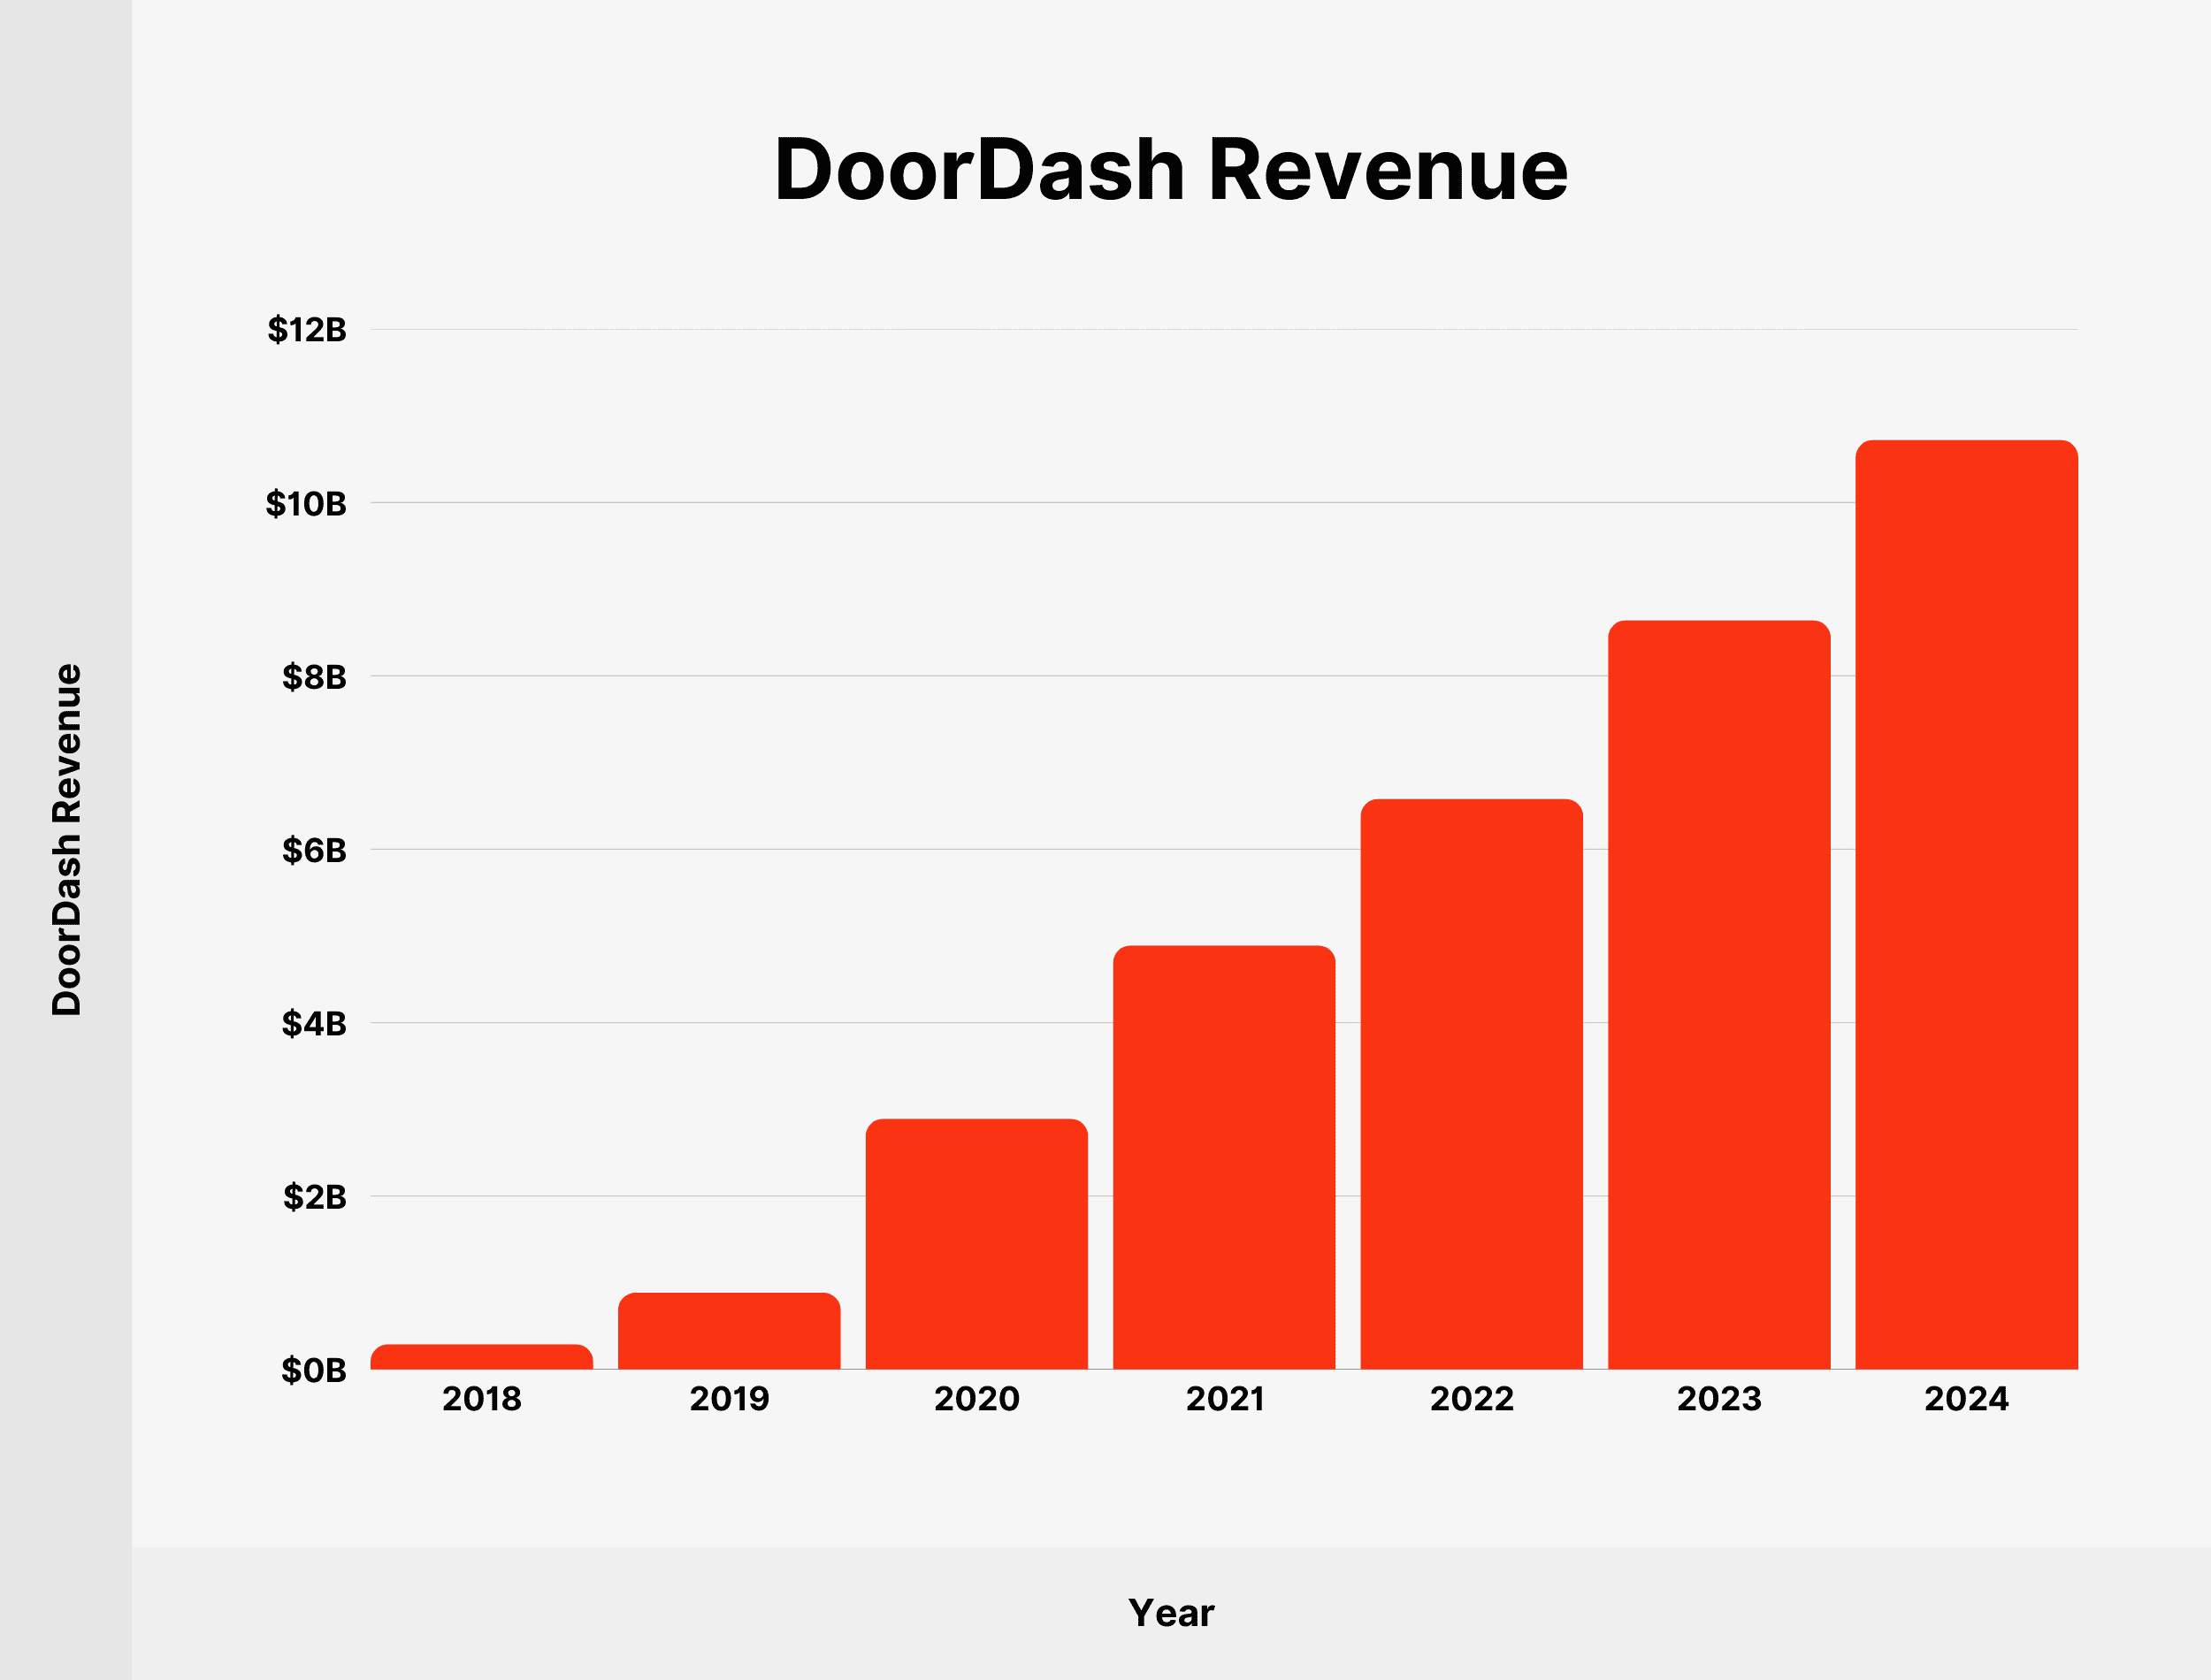
Over the past year, the delivery company’s annual revenue increased by 24.07%.
Here’s a table showing DoorDash’s revenue since 2018:
| Year | DoorDash Revenue |
|---|---|
| 2018 | $291 million |
| 2019 | $885 million |
| 2020 | $2.89 billion |
| 2021 | $4.89 billion |
| 2022 | $6.58 billion |
| 2023 | $8.64 billion |
| 2024 | $10.72 billion |
Source: DoorDash
DoorDash Operating Expenses
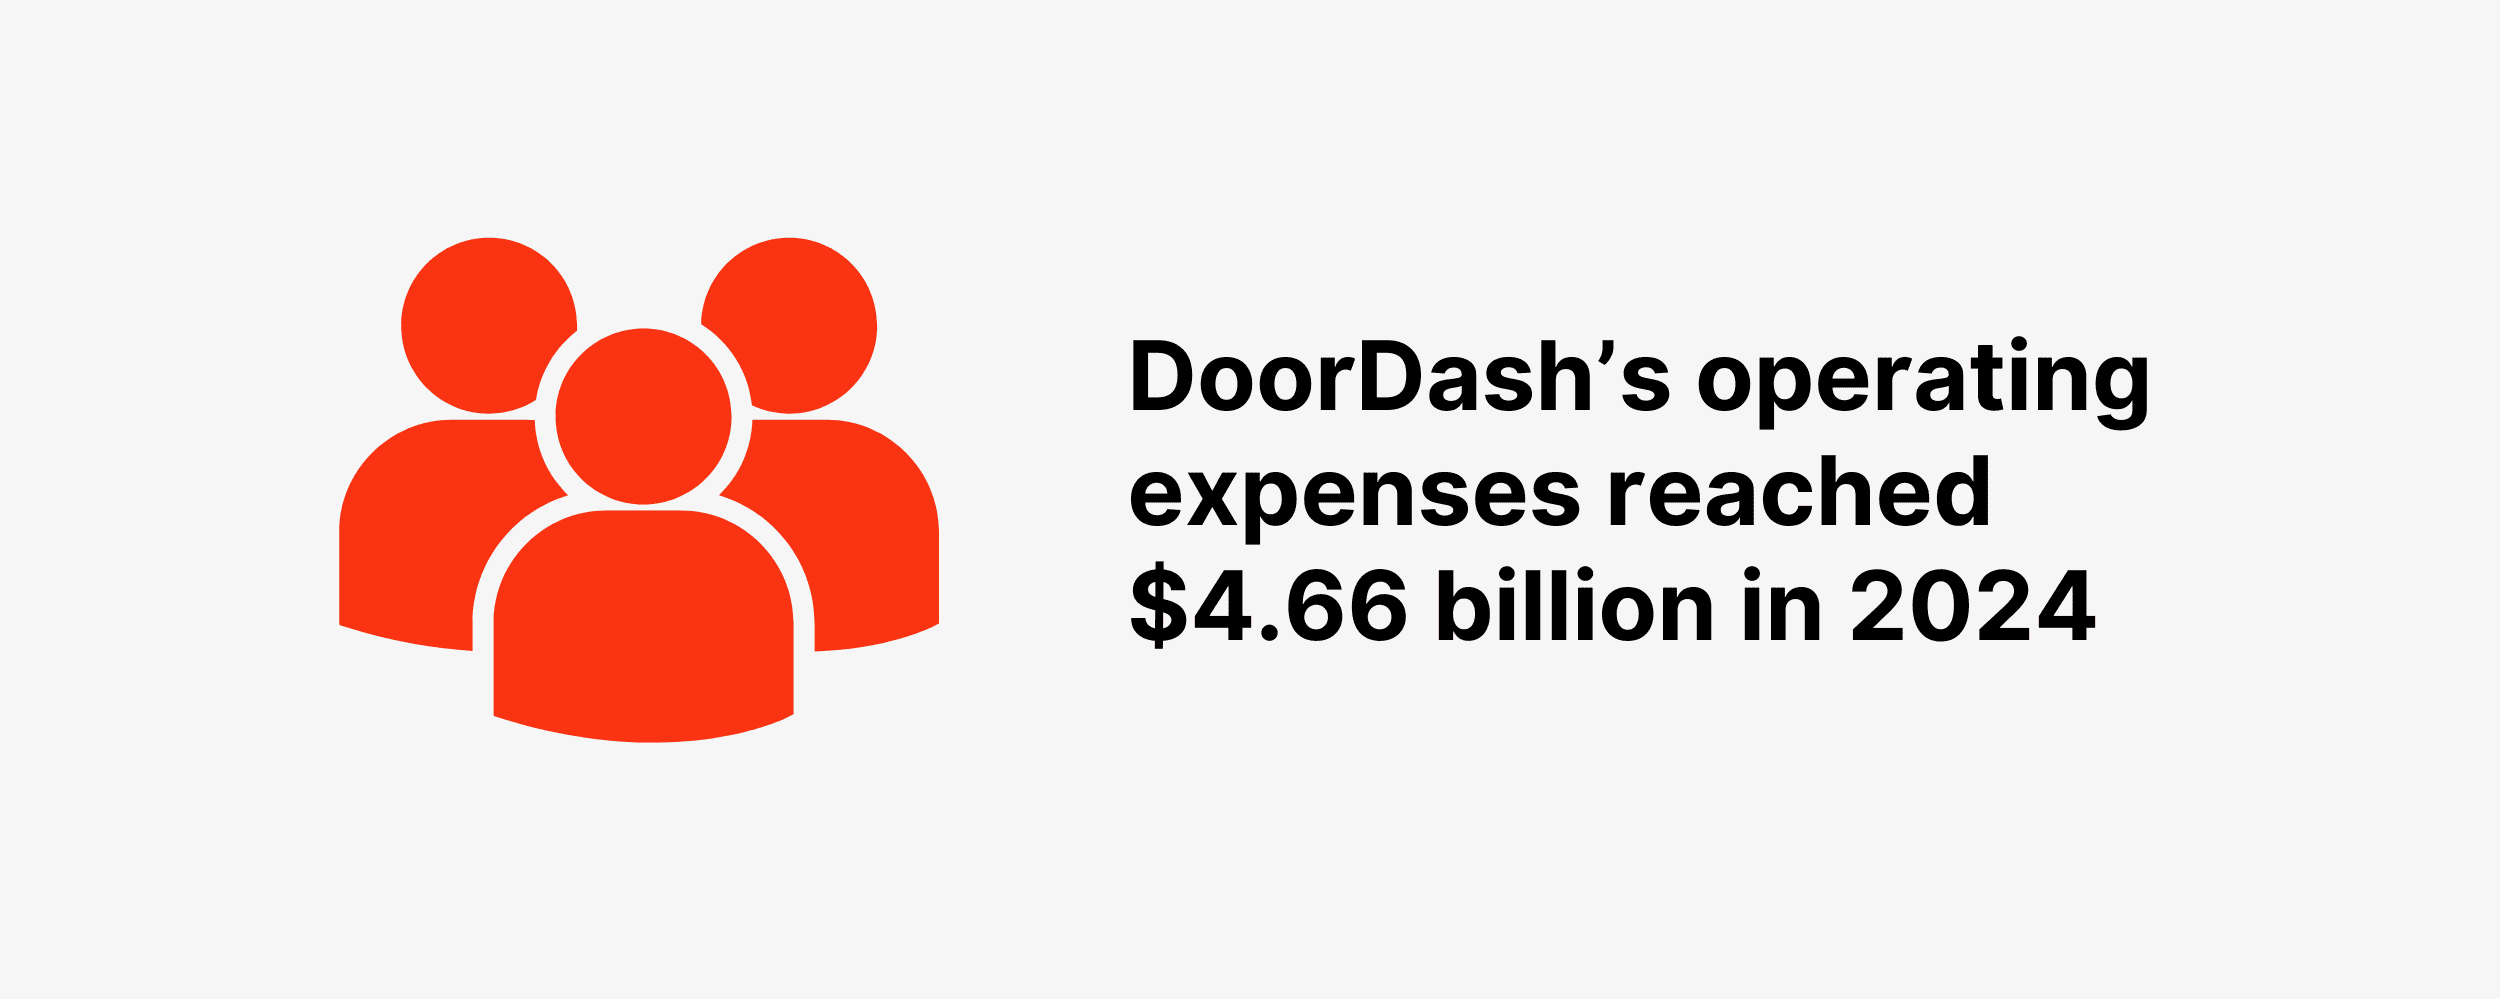
DoorDash’s operating expenses include sales and marketing, research and development, and general and administrative. These expenses reached $4.66 billion in 2024.
The delivery brand reported spending $2.04 billion on sales and marketing in 2024. Annual DoorDash sales and marketing expenses in 2024 increased by 8.58% over the previous year.
This table shows DoorDash’s sales and marketing expenses since 2018:
| Year | DoorDash Sales and Marketing Expenses |
|---|---|
| 2018 | $135 million |
| 2019 | $594 million |
| 2020 | $957 million |
| 2021 | $1.62 billion |
| 2022 | $1.68 billion |
| 2023 | $1.88 billion |
| 2024 | $2.04 billion |
Research and development accounted for $1.17 billion of DoorDash’s expenses in 2024.
We’ve displayed figures for DoorDash’s research and development expenses since 2018:
| Year | DoorDash Research and Development Expenses |
|---|---|
| 2018 | $51 million |
| 2019 | $107 million |
| 2020 | $321 million |
| 2021 | $430 million |
| 2022 | $829 million |
| 2023 | $1 billion |
| 2024 | $1.17 billion |
DoorDash reported $1.45 billion in general and administrative expenses in 2023.
Here’s a table showing DoorDash’s general and administrative expenses from 2018:
| Year | DoorDash General and Administrative Expenses |
|---|---|
| 2018 | $78 million |
| 2019 | $245 million |
| 2020 | $556 million |
| 2021 | $797 million |
| 2022 | $1.15 billion |
| 2023 | $1.24 billion |
| 2024 | $1.45 billion |
Source: DoorDash
DoorDash Employees
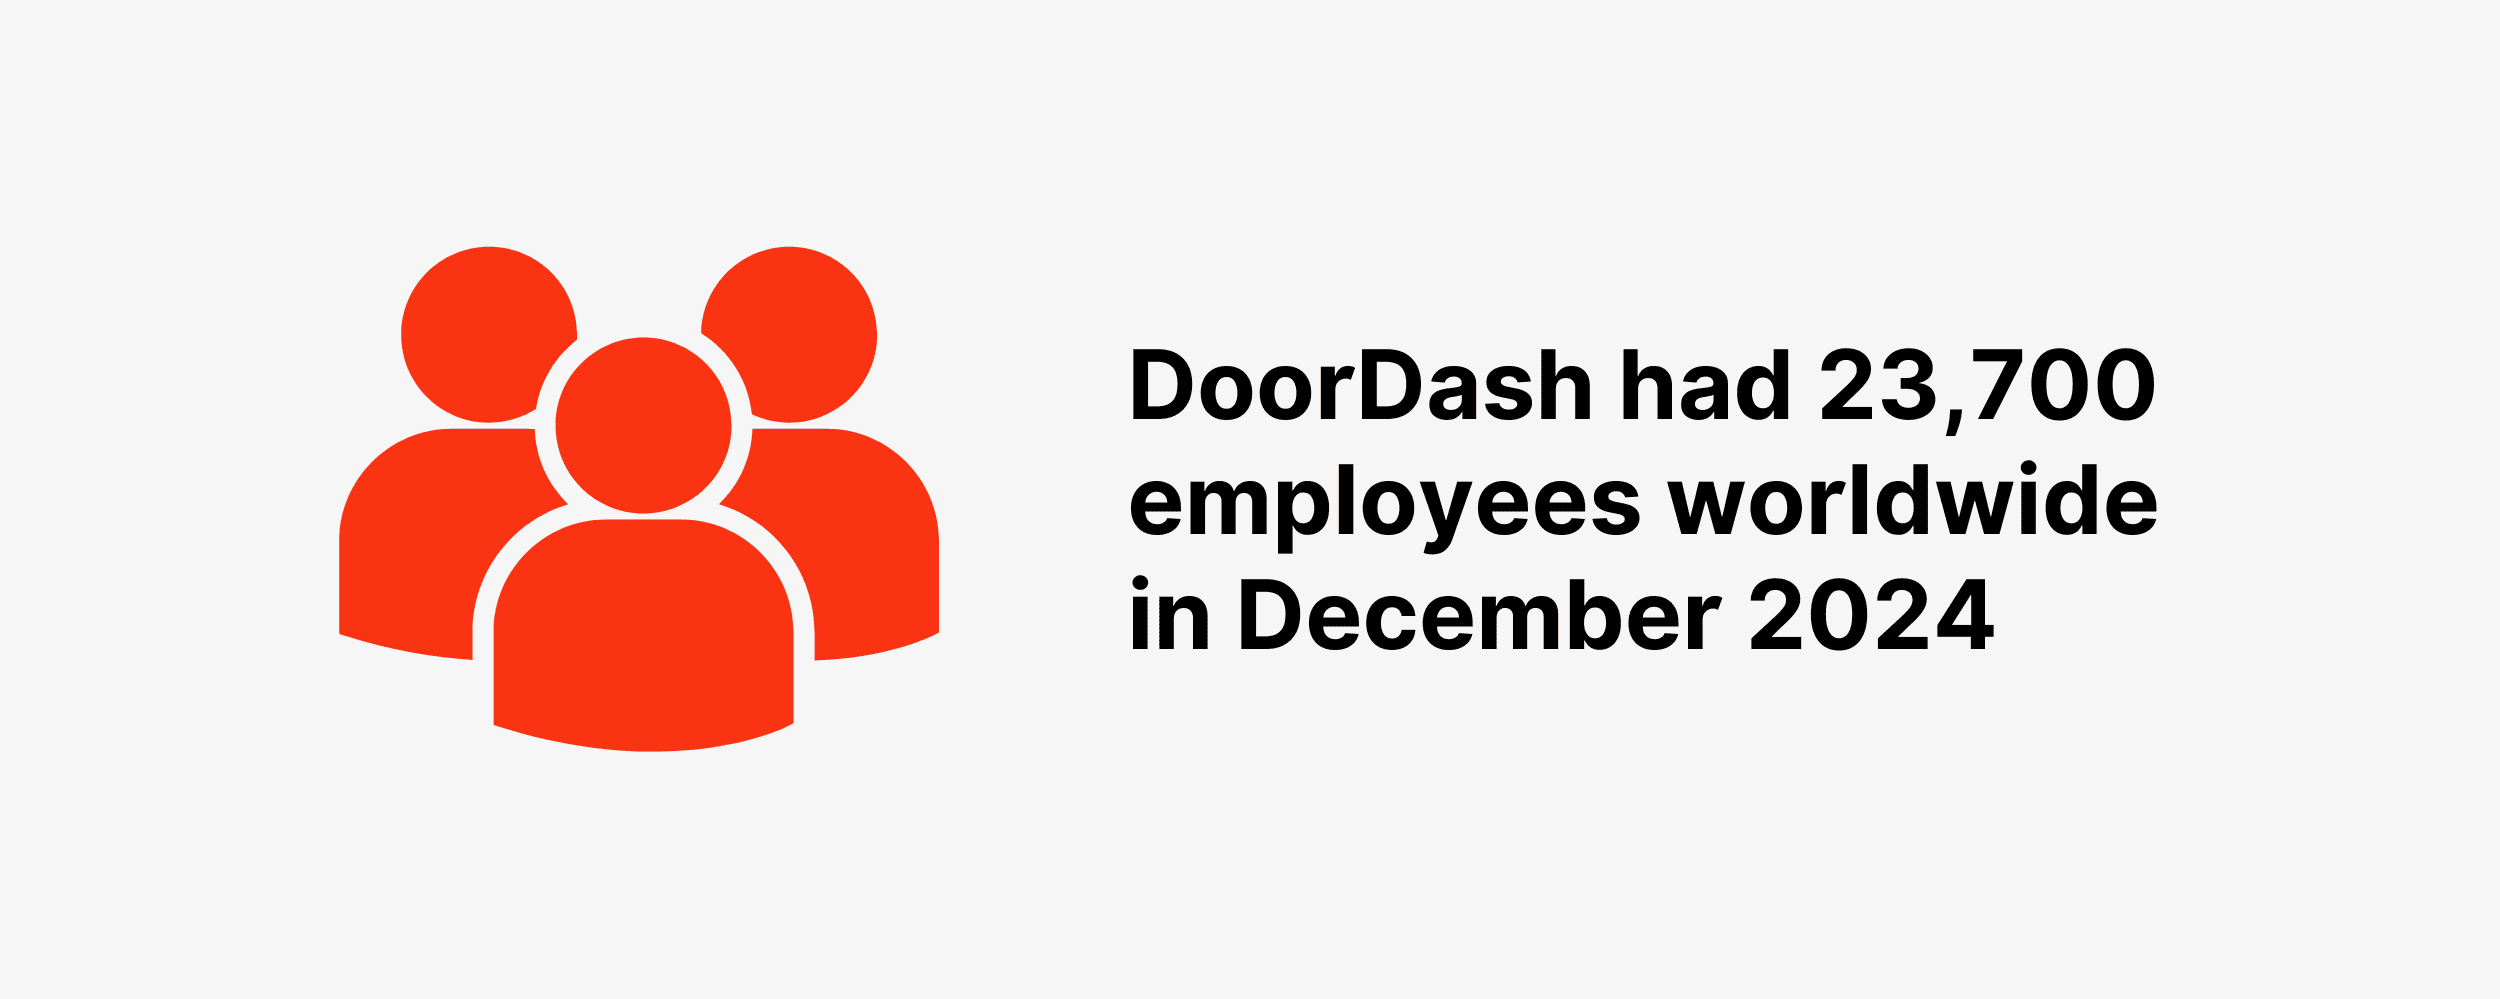
DoorDash had 23,700 employees worldwide in December 2024. That’s an increase from 19,300 employees in December 2023.
Based on 108 records, the median salary for employees with H1B visas at DoorDash in the US is $176,000.
Here’s a table with the number of employees at Upwork since 2020:
| Year | DoorDash Employees |
|---|---|
| 2020 | 3,886 |
| 2021 | 8,600 |
| 2022 | 16,800 |
| 2023 | 19,300 |
| 2024 | 23,700 |
Sources: DoorDash, H1B Salary Database
Conclusion
That’s all for our collection of DoorDash stats in 2026.
DoorDash has shown strong performance by gaining market share both in the US and internationally (with the recent Wolt acquisition) and maintaining a consistent revenue growth track record.
However, the meal delivery sector is highly competitive with the likes of Grubhub and Uber Eats. It will be interesting to see if DoorDash can sustain its current pace of growth in the future.
Backlinko is owned by Semrush. We’re still obsessed with bringing you world-class SEO insights, backed by hands-on experience. Unless otherwise noted, this content was written by either an employee or paid contractor of Semrush Inc.

