32 Mind-Blowing Instagram Marketing Stats
This is a complete list of up-to-date Instagram marketing stats.
In this new list you’ll find stats on:
- Instagram Reels
- Instagram Stories
- User growth
- Advertising
- Lots more
So without further ado, let’s get right
into the Instagram statistics on this list.

01.Instagram Engagement Statistics
Engagement is one of the main reasons that marketers LOVE Instagram. Unlike Facebook and X/Twitter, engagement on Instagram is increasing.
- Instagram’s median engagement rate is 0.36% across all industries. That’s almost 8x higher than Facebook posts and 24x higher than a tweet (Rival IQ)
Social Media Platform Median Engagement Rate Instagram 0.36% Facebook 0.046% Twitter 0.015% - The best days to post on Instagram are Tuesdays through Thursdays (Sprout Social)
- A 2025 study found that Higher Education outperformed every other industry in terms of post engagement, hitting 2.1% (Rival IQ)
02.Video on Instagram Stats
Stories. Video posts. Instagram Reels. There’s no question that video on Instagram is blowing up right now. But do videos work better than images? If so, how do they compare? These stats about videos on Instagram have you covered.
- On average, Instagram Reels get an engagement rate between 6.59% and 8.77%, depending on the number of followers (eMarketer)
Number of Followers Instagram Reels Engagement Rate 100K-500K 6.59% 500K-1 million 6.68% 1 million – 5 million 6.15% 5 million – 10 million 7.49% 10+ million 8.77% - The average views for Instagram Reels were 120,917 across various account sizes and industries (eMarketer)
- Video posts on Instagram typically generate an average of 150 comments, while image and carousel posts bring in 65 and 80 comments, respectively (Mention)
- On average, video posts get 3.15x more likes compared to image posts on Instagram (Mention)

Post Type on Instagram Average Likes Video 1832 Carousel 1358 Image 581
03.Instagram Stories Statistics
Social media marketing pros know that Stories are one of the best ways to boost engagement on Instagram. After all, you have to watch them within 24 hours… or they’re gone for good. And, as you’ll see from these new stats, there’s data to back up the fact that stories should be part of your marketing efforts on this social network.
- 78.01% of Gen Z (ages 15-26) social media users in the US have watched Instagram Stories in the past month (eMarketer)
- 98.1% of US creators use Instagram Stories to post sponsored content (eMarketer)

Sponsored Content Type Share of US Creators Instagram feed posts 98.4% Instagram Stories 98.1% Instagram Reel 98.0% TikTok video 89.6% Instagram Live 69.1% Facebook post 68.9% YouTube Short 62.6% Blog post 59.5% YouTube video 58.9% Pinterest Pin 54.3% Tweet 45.9% - Nearly 7 in 10 users have swiped up to access links on branded stories (Mention)
04.Instagram Demographics
With around 2 billion users, it’s no secret that Instagram is used by people from all over the world. Question is: What country is Instagram most popular in? And what age group uses Instagram the most? If you guessed “India” and “young adults”, you’re right.
- India (472.8 million), the US (179.9 million), and Brazil (147 million) are the top 3 countries with Instagram users (DataReportal)
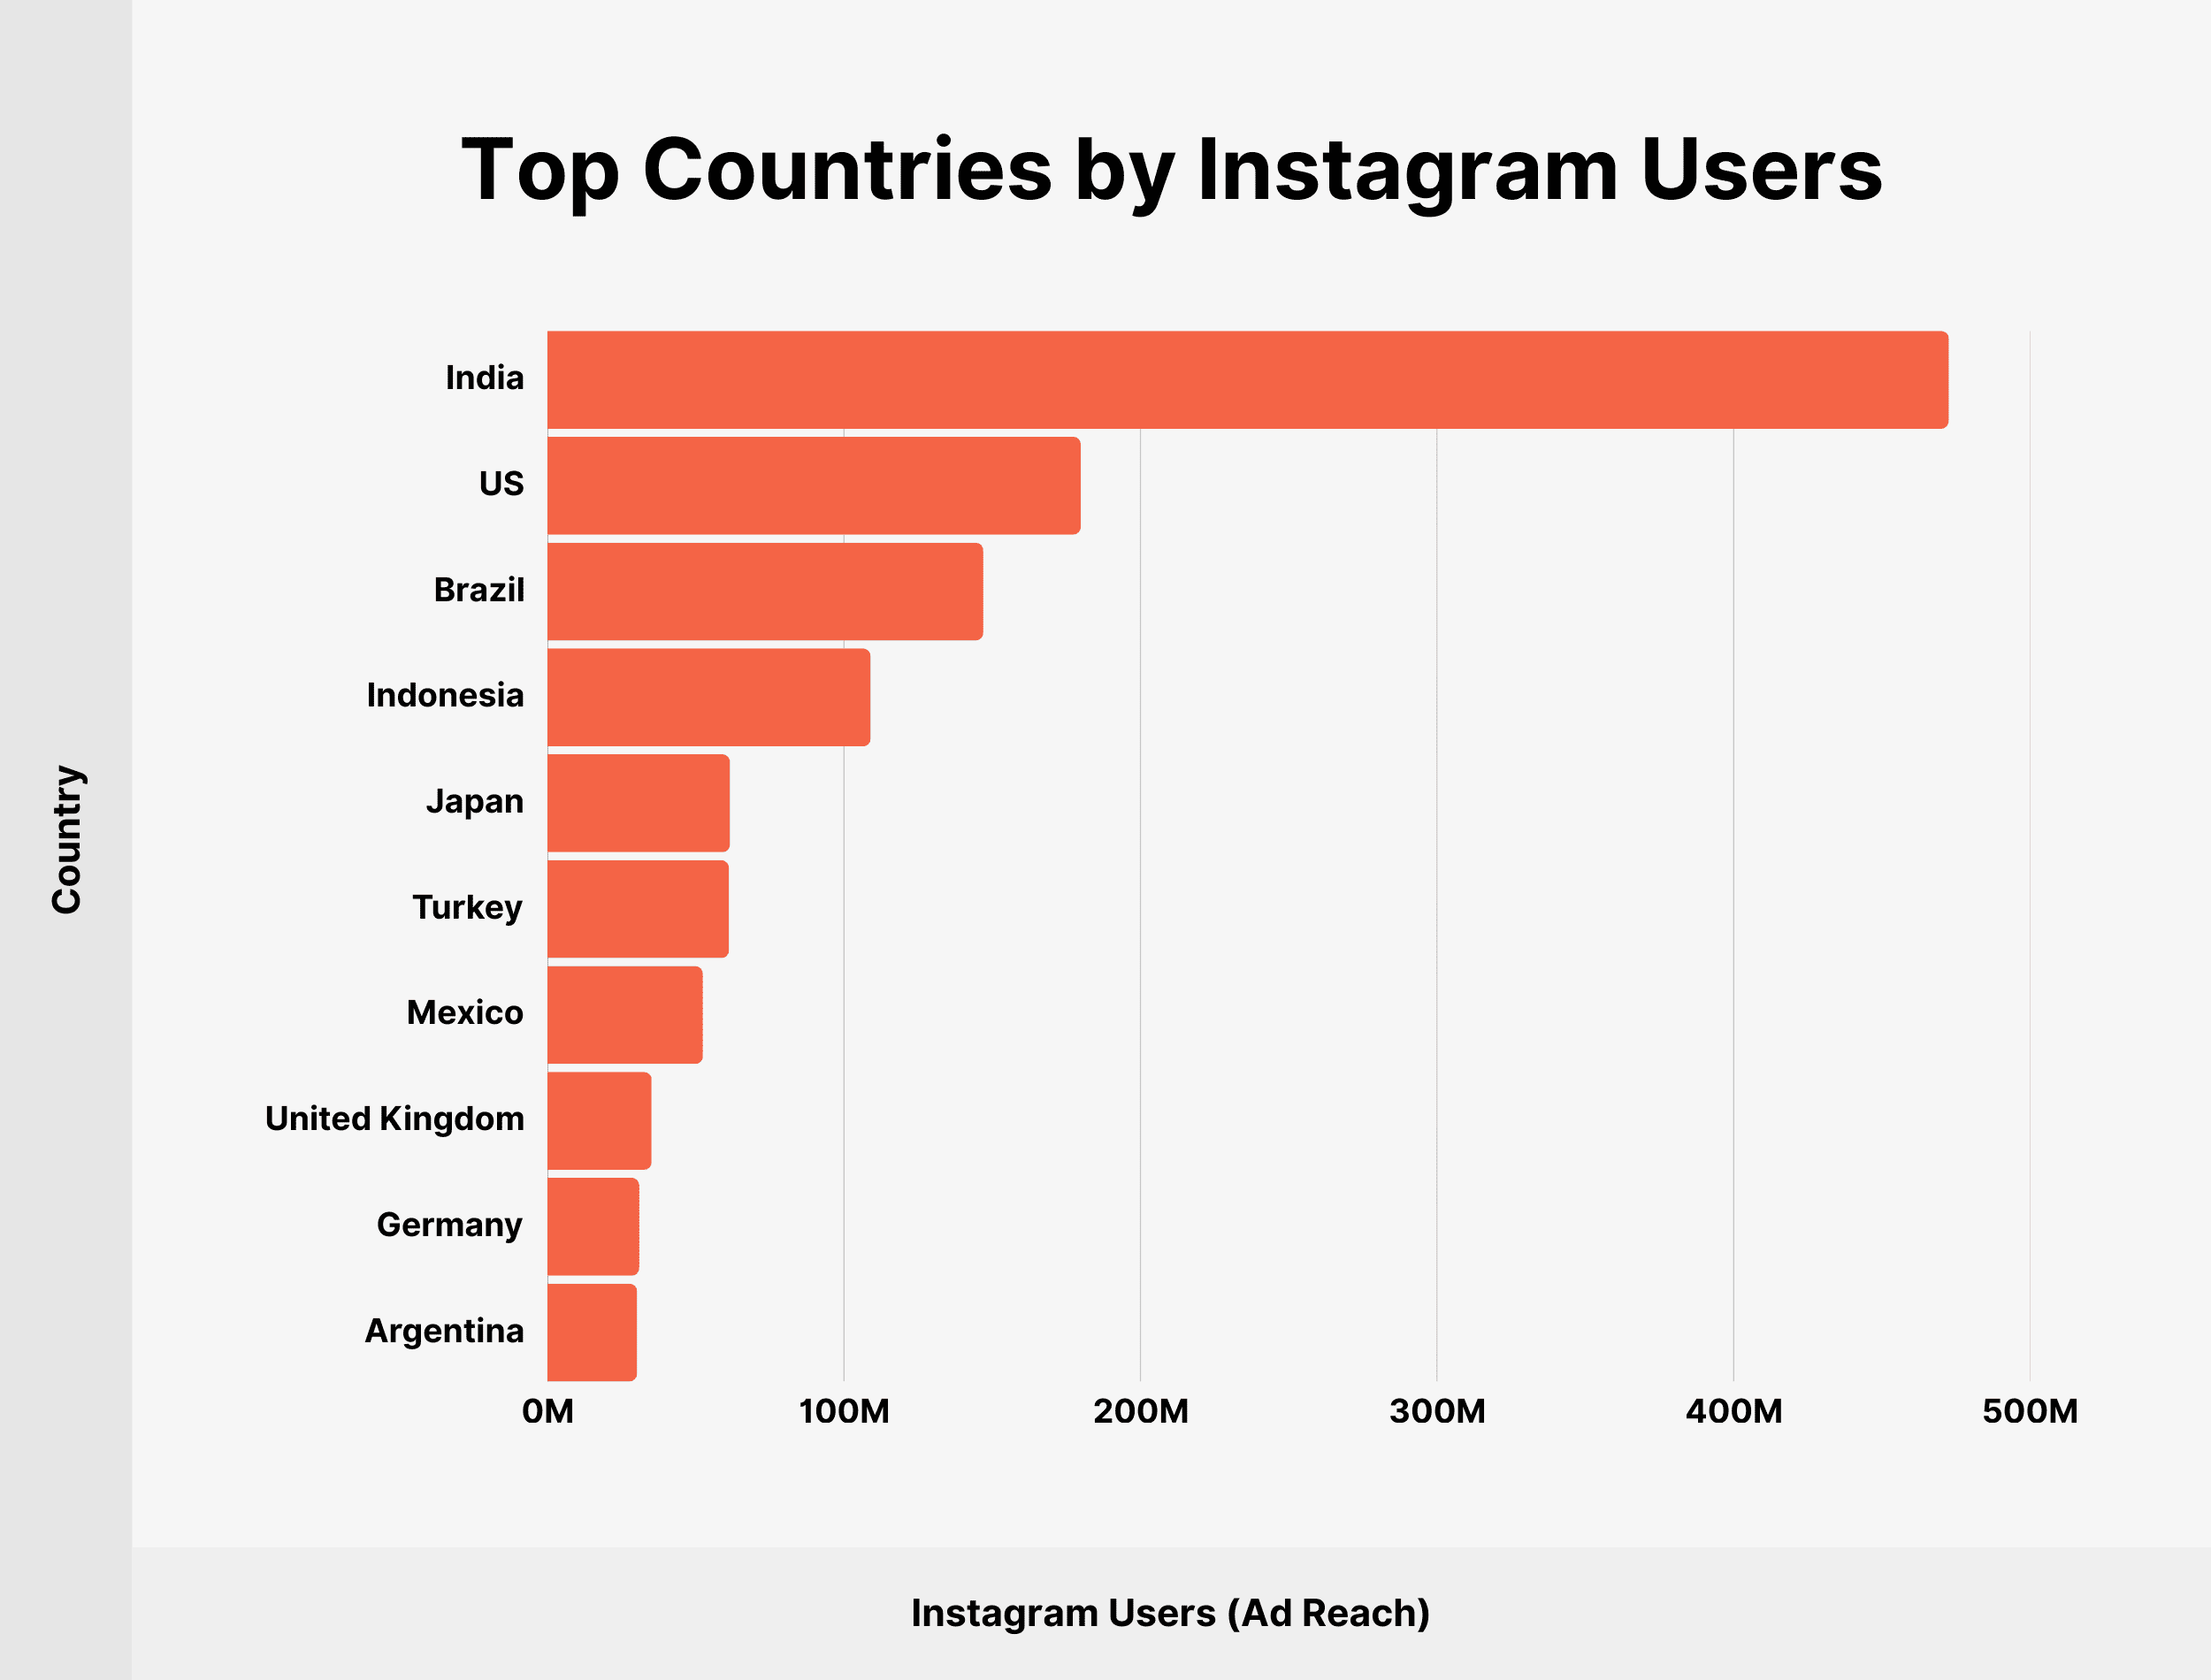
Country Instagram Users (Ad Reach) India 472.6 million US 179.9 million Brazil 147 million Indonesia 109 million Japan 61.6 million Turkey 61.25 million Mexico 52.45 million United Kingdom 35.15 million Germany 31 million Argentina 30.25 million - 47% of American adults use Instagram (Pew Research Center)
- Instagram has 135.2 million monthly active users in the US (eMarketer)
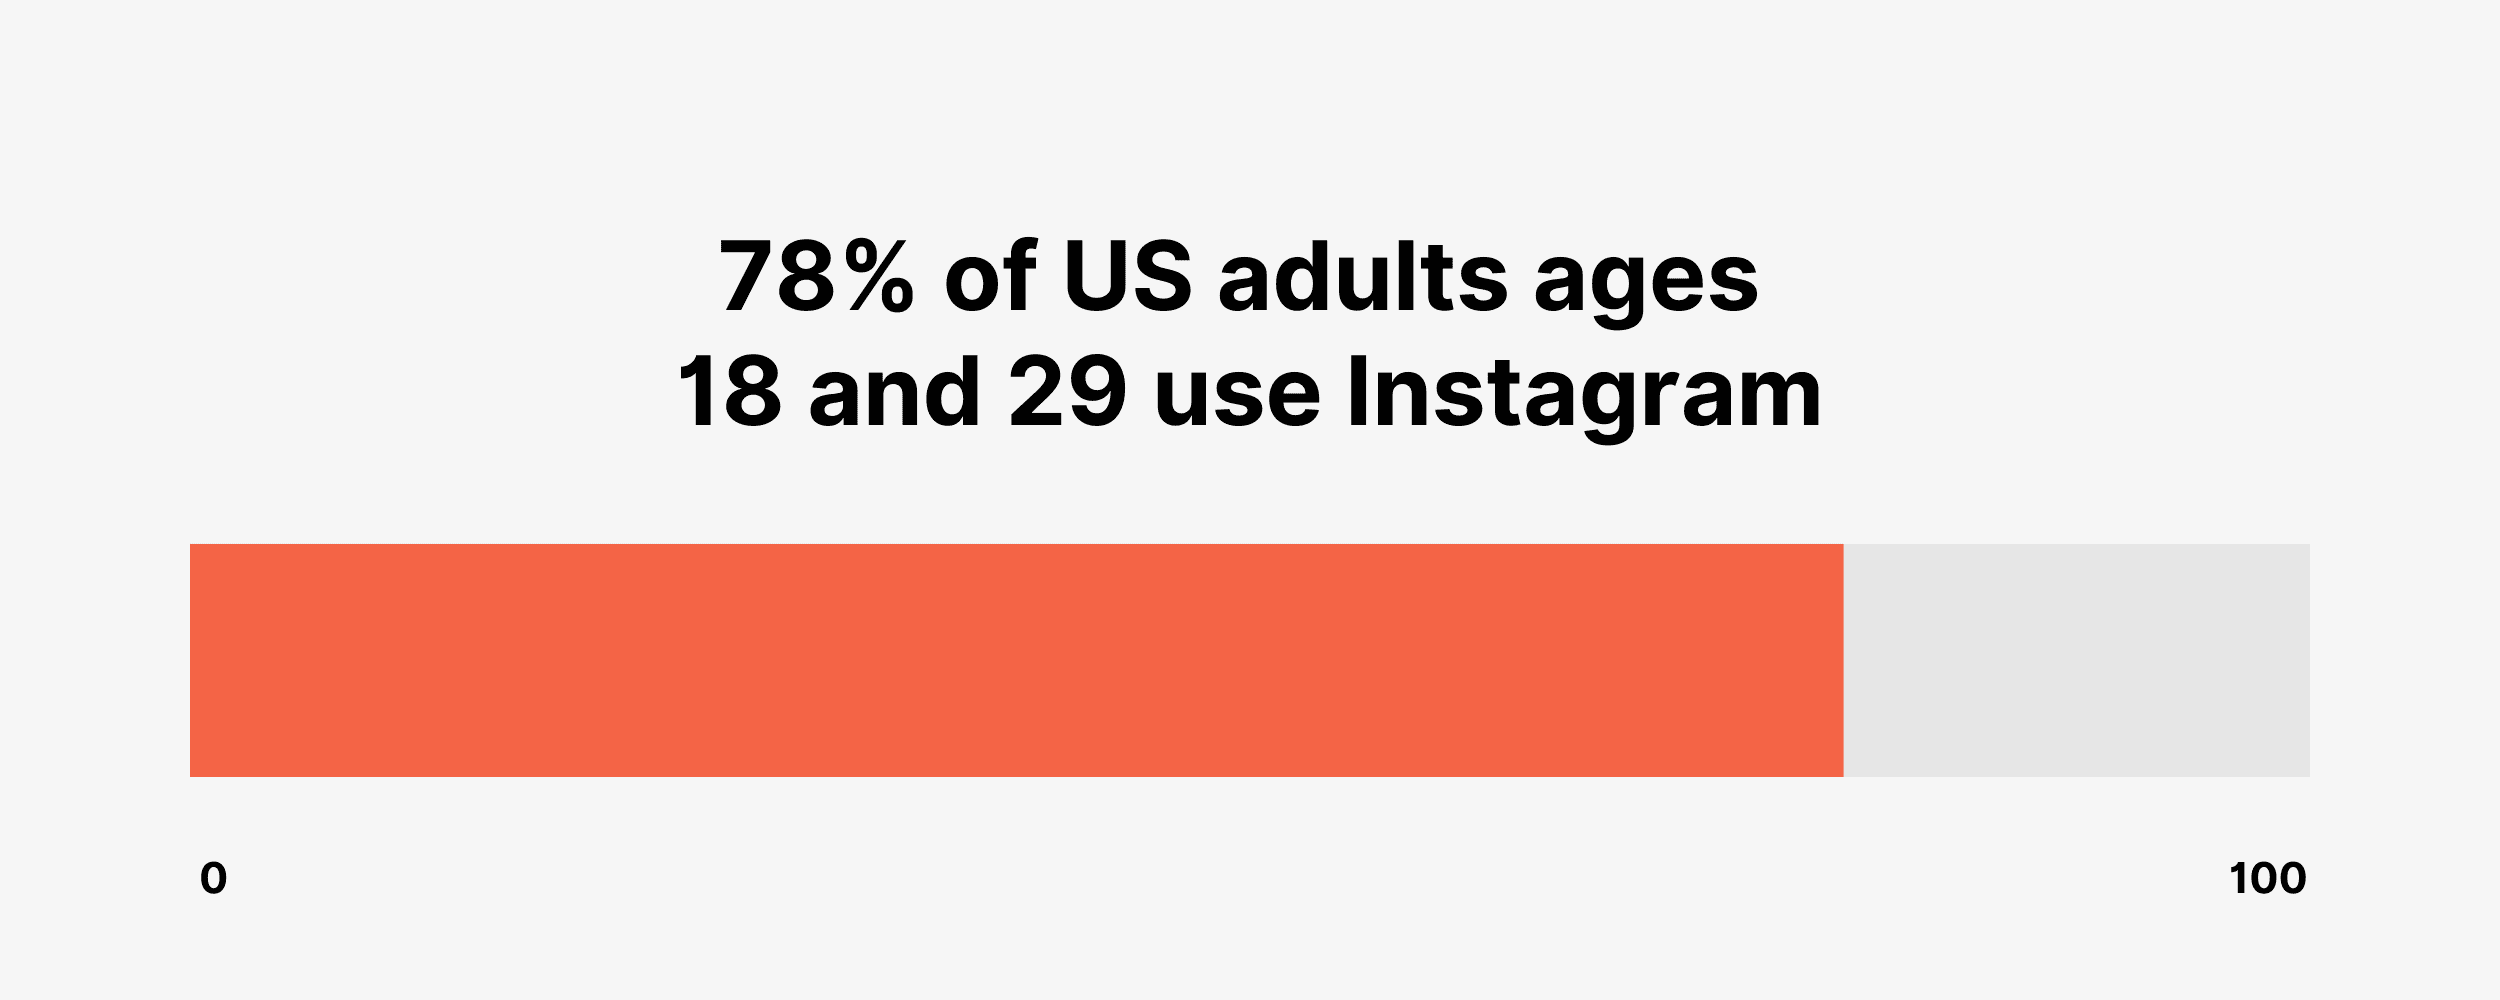
- 78% of US adults aged 18 to 29 use Instagram (Pew Research Center)
- 72.2% of Gen Z social media users in the US used Instagram for direct messaging in the past month (eMarketer)
- The largest group of Instagram users is 25-34 year-olds, who make up 24.9% of the platform audience in the US (Statista)
- Approximately 54.5% of internet users worldwide are on Instagram (DataReportal)
05.Instagram Marketing Benchmarks & Trends
Now it’s time to cover a bunch of Instagram Marketing stats that show how people use the platform, who they follow, and how marketers use Instagram to get more traffic, leads, sales, and exposure for their business.
- Instagram boasts over 2 billion monthly active users (Instagram)

- 62.7% of Instagram users follow or research brands and products on the platform (DataReportal)
- More than half (51%) of Gen Zers worldwide prefer to use social media (including Instagram) to research brands, products, or services instead of search engines (eMarketer)
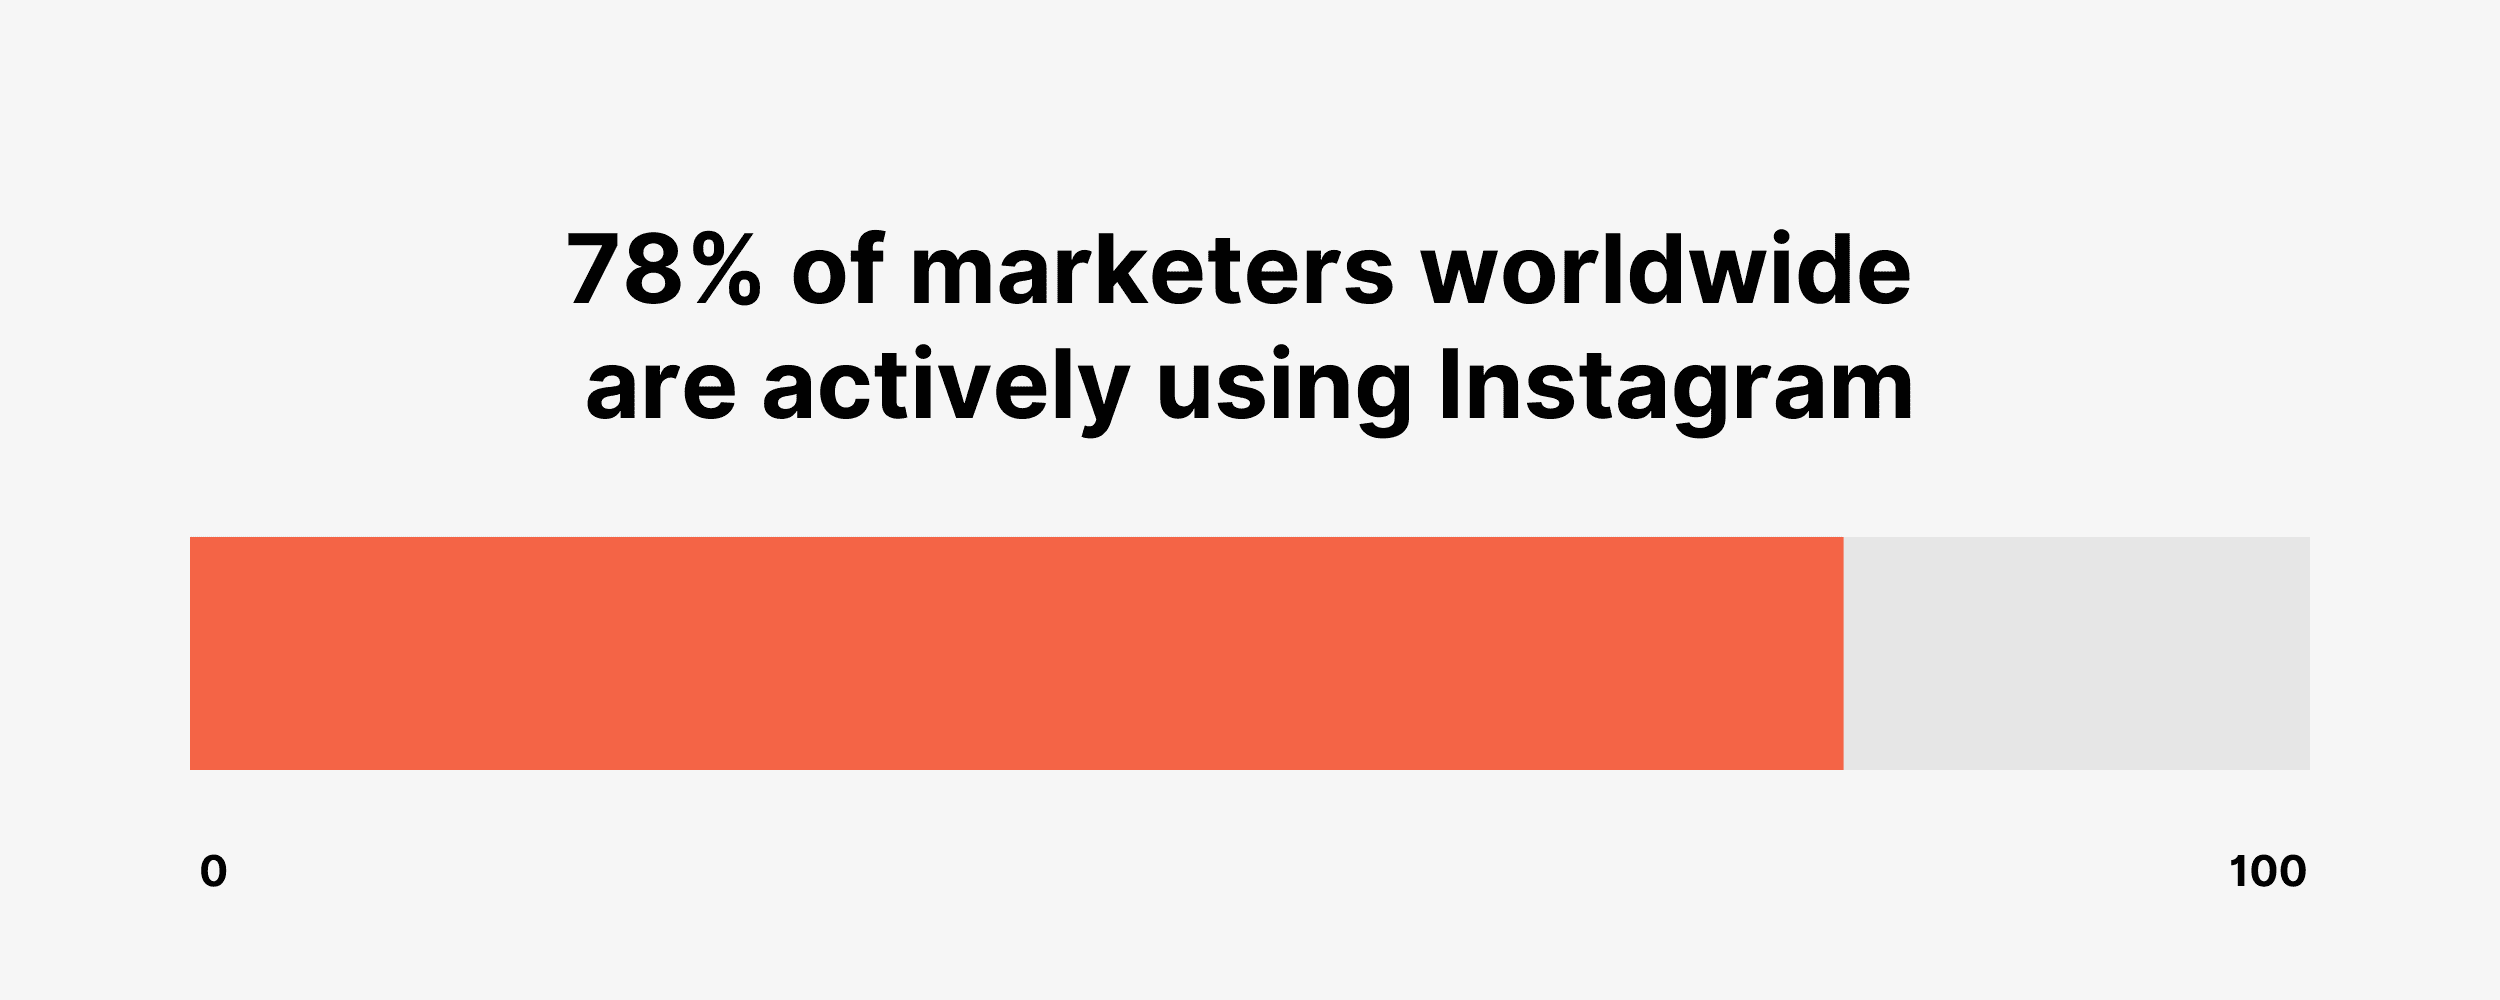
- 78% of marketers worldwide are actively using Instagram (Statista)
- 3.15% of all Instagram users have more than 50,000 followers (Mention)
- In North America, 75% of Instagram users have more than 1,000 followers (Mention)
- 76.37% of all Instagram users have less than 10,000 followers (Mention)
- US adult users who use Instagram at least once a month spend an average of 33.1 minutes a day on the app (eMarketer)
- Instagram is the second most used social platform among marketers, behind only Facebook (Statista)
- Posts that used 11+ hashtags had the highest engagement rate, followed by 4 hashtags (Mention)
- The top 3 hashtags used on Instagram are #photography, #love, and #art (Mention)

- The top 3 hashtags on Instagram that attract the most engagement are #reelstrending, #calisthenics, and #funnyvideos (Mention)
07.Instagram Advertising Statistics
Instagram Ads are the hot new thing in the digital marketing world. This shouldn’t come as a surprise: Instagram is “stealing” time and attention away from platforms like Facebook. And considering advertisers need to go where their potential customers are, chances are they’re spending tons of time on Instagram.
- Instagram generated $70.9 billion in ad revenue in 2024 (Oberlo)
Date Instagram Ad Revenue 2017 $3.8 billion 2018 $8.6 billion 2019 $18.9 billion 2020 $28.4 billion 2021 $48.3 billion 2022 $16.5 billion 2023 $61.1 billion 2024 $70.9 billion - The average cost-per-click across Instagram ads with targeting audiences in the US amounted to $1.32 in December 2025 (Revealbot)
- Cost-per-click significantly varies depending on campaign objectives, ranging from $0.22 (traffic) to $11.19 (brand awareness) (Revealbot)
Conclusion
That’s it for this list of Instagram marketing statistics.
With its large user base and high engagement, Instagram is a prime platform for reaching audiences effectively.


