

This is a complete list of up-to-date influencer marketing statistics.
You’ve come to the right place if you’re looking for carefully selected stats on:
Read on to find out everything you need to know about influencer marketing.
Platforms
There are influencers on just about every social network, from Instagram to TikTok. But which sites are the most popular for influencer marketing? Which are the most effective? These statistics have the answers.
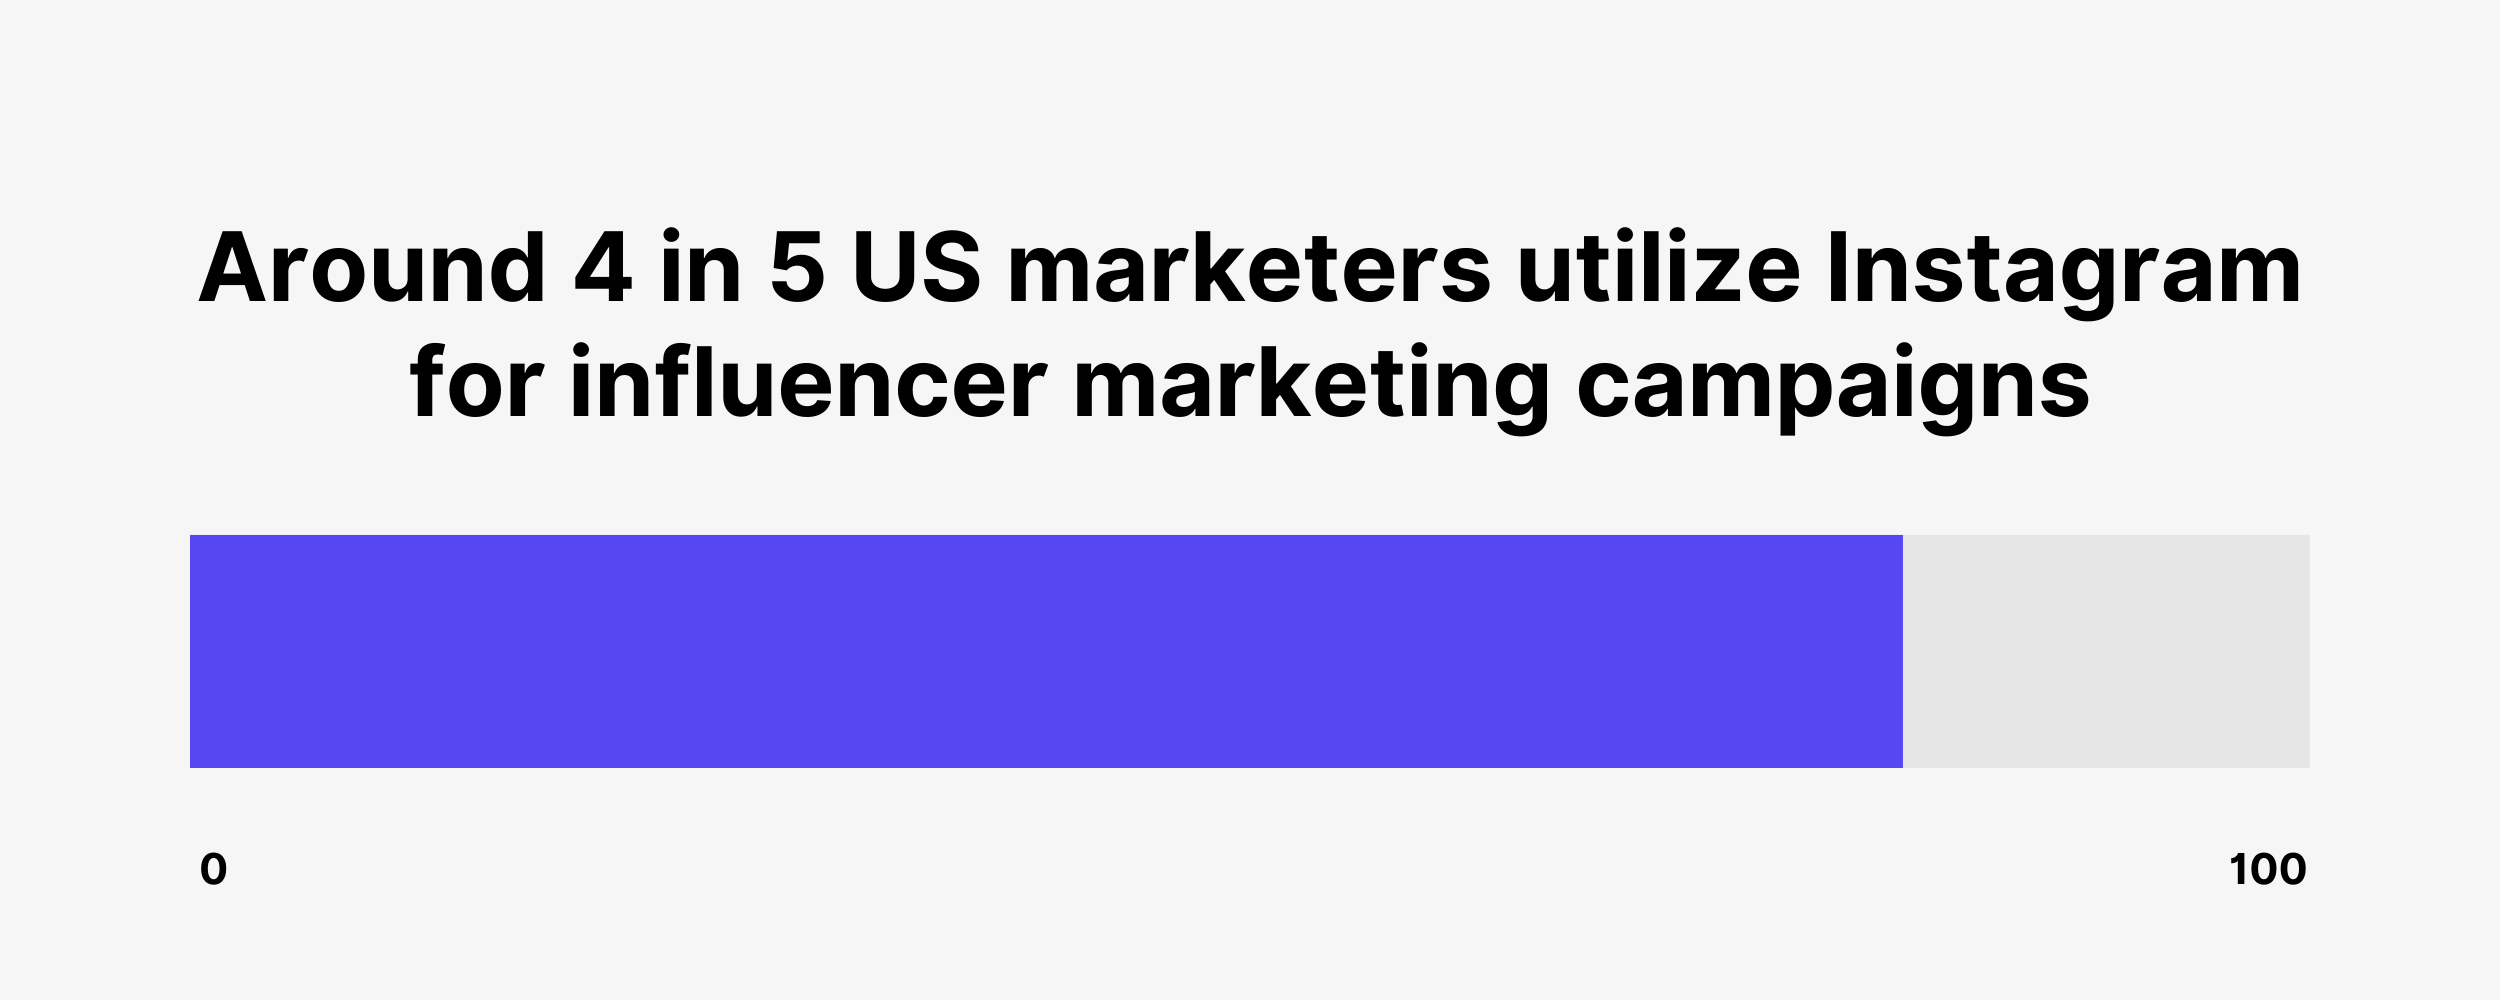
- 80.8% of US marketers utilize Instagram for influencer marketing campaigns, more than any other platform (Statista)
- More than half (57.7%) of US marketers at companies with over 100 employees use TikTok for influencer marketing (eMarketer)
- On average, the engagement rate for Instagram influencers with over 1.5 million followers stands at 2.8%. Among popular TikTok influencers (with 1.5+ million followers), the average engagement rate reached 4.95% (Captiv8)
- Influencers are most active on Facebook – they average 4.19 posts per week on this platform. Instagram influencers are a close second with 4.5 posts per day, while influencers on X (Twitter) average a more reserved 2.16 tweets per week (Rival IQ)
- US influencer marketing spending on Instagram reached an estimated $2.21 billion in 2024, followed by TikTok ($1.25 billion) and YouTube ($1.07 billion) (eMarketer)
Content Types
Once a business has partnered with an influencer, there can be a great deal of creativity in the campaign that follows. These statistics show the types of content that brands, influencers, and consumers prefer.
- Instagram post remains the most popular content format influencers have been paid by brands to create (84.2% of respondents), followed by Instagram Reel (63.8%), TikTok (27.4%), and Facebook post (26.8%) (Later)
- Hashtags like #fyp and #foryou resonated the most with users on TikTok, accounting for engagement rates of 21.97% and 20.3% (Rival IQ)
- Photos generate the most engagement for influencers on both Facebook and X (Twitter) (Rival IQ)
- By contrast, Instagram influencers get the most engagement from Carousels, overtaking Reels (Rival IQ)
- Instagram is a top platform for posting sponsored content by influencers in the US, with over 98% posting Reels, Stories, or feed posts on the platform. Other popular sponsored content types shared by US creators include TikTok videos (89.6%), Instagram Live (69.1%), Facebook posts (68.9%), and YouTube Shorts (62.6%) (eMarketer)
- Cooking recipes are considered the most popular form of influencer content, according to 51% of worldwide social media users, followed by lifestyle content (42%), tutorials (42%), and product reviews (41%) (eMarketer)
State of the Industry
Influencer marketing has firmly entered the mainstream. These statistics reveal the extent to which brands are turning to influencers.
- Around 86% of US marketers are estimated to use influencer marketing in 2025, up from 64.5% in 2020 (eMarketer)
- US-sponsored content spending is estimated to reach $9.29 billion in 2025, an 81.4% increase since 2021 (eMarketer)
- Around 59% of surveyed brands say they plan to increase their investment in influencer marketing in the next year (LTK)
Effectiveness
Conventional wisdom says that consumers trust individual recommendations more than traditional advertising. But does this hold true when the recommendations come from influencers? These statistics show the true effectiveness of influencer marketing.
- Over one-third (31%) of US adults think their purchasing decisions are “somewhat often” or “very often” influenced by social media influencers. Over half (52%) of 18-29-year-olds state their purchases are impacted by influencers (YouGov)

- Around 33% of Gen Zers in the US have bought a product from an influencer-founded brand in the past year. Among millennials, 29% have made a purchase from an influencer-founded brand. (eMarketer)
- One-third (30%) of B2B marketers say influencer marketing contributes the most to achieving their top-of-funnel goals, more than paid search (28%) or virtual events (23%) (Wpromote)
- One study found that Instagram nano-influencers (with fewer than 10,000 followers) get significantly higher engagement rates of 6.23% compared to a 0.70% engagement rate on TikTok within the same follower range (Captiv8)
- On average, the engagement rate for Instagram influencers with over 1.5 million followers stands at 2.8%. Among popular TikTok influencers (with 1.5+ million followers), the average engagement rate reached 4.95%. (Captiv8)
Budgets
Ever wondered how much brands spend on influencer marketing? These stats have you covered.
- US influencer marketing spending is forecast to hit $13.7 billion in 2027, up from $12.7 billion in 2026 (eMarketer)
- In a recent survey among marketing agencies and brands, 26.3% of respondents stated they invested 10 to 20 percent of their marketing budget into influencer marketing. Another 11.9% allocated more than 50 percent to this type of digital marketing activity (Statista)
- When it comes to influencer compensation, the median rate for sponsored Instagram posts is estimated to reach $400 for an influencer with 100,000-150,000 followers. Instagram influencers (with a follower count between 100 and 150 thousand) typically set a rate of $1,500 per Instagram Reel (Later)
- TikTok creators typically charge a median rate of $700 per video, while the range usually ranges between $250 and $1,700 (Later)
Analytics
Marketers in every field need effective ways of tracking their performance. This is no different in the world of influencer marketing. These statistics show the KPIs and metrics that brands are using to track the success of their influencer collaborations.
- Audience growth (61%), awareness (53%), and conversion rates (48%) are considered the most important metrics for influencer campaigns among brands (LTK)
- Marketers consider reach (CPM), engagement rate, and conversions as the top 3 measures of success for influencer marketing campaigns (Linqia)
- 53% of marketers state their biggest challenge with influencer marketing is determining ROI (Linqia)
Conclusion
That’s it for my list of influencer marketing statistics.
I hope you found the stats as interesting and informative as I did.
Backlinko is owned by Semrush. We’re still obsessed with bringing you world-class SEO insights, backed by hands-on experience. Unless otherwise noted, this content was written by either an employee or paid contractor of Semrush Inc.