Hulu publicly launched its video-on-demand service in March 2008.
The platform hit 1 million paying subscribers in 2011. Subscription numbers have seen consistent quarterly growth ever since.
Disney bought a majority stake in Hulu in December 2017, propelling further growth. In 2023, Disney fully acquired Hulu.
Today, Hulu has 55.5 million paying subscribers.
Continue reading to find out all the latest stats on Hulu.
Let’s get right into the data:
- Key Hulu Statistics
- Hulu Viewers
- Time Spent with Hulu
- Hulu Subscribers
- Hulu Subscribers by Plan Tier
- What Is Hulu’s US Market Share?
- Live TV on Hulu
- Hulu Gender Demographics
- Hulu Subscribers by Generation
- Hulu Subscriber Political Affiliation
- Where Are Hulu Subscribers From?
- Hulu Subscriber Race Demographics
- Hulu Subscriber Annual Income
- Hulu Advertising Revenue
- Hulu’s Average Revenue per Streaming Subscriber
- Hulu’s Average Revenue per Live TV Subscriber
- Hulu’s Retention Rate
- Hulu Content Library
- How Many Employees Does Hulu Have?
Key Hulu Statistics
- Hulu has 55.5 million paying subscribers.
- 4.4 million users subscribe to the Hulu Live TV bundle.
- 65% of Hulu subscribers with an ad-free plan stay with the platform after 6 months.
- Hulu’s average monthly revenue is $12.35 per paying subscriber (excluding Live TV subscribers).
- Hulu generates an average of $95.12 in monthly revenue per Live TV subscriber.
Hulu Viewers
Hulu has an estimated total viewership of 130.7 million users, behind Netflix (173.3 million) and Amazon Prime (163.6 million).

Source: eMarketer
Time Spent with Hulu
On average, Hulu users spend 53 minutes per day watching content on Hulu.
Source: eMarketer
Hulu Subscribers
Hulu has 55.5 million paying subscribers. During the last year alone (Q3 2024 – Q3 2025), the streaming service has added 4.4 million new subscribers, an 8.61% year-over-year increase.
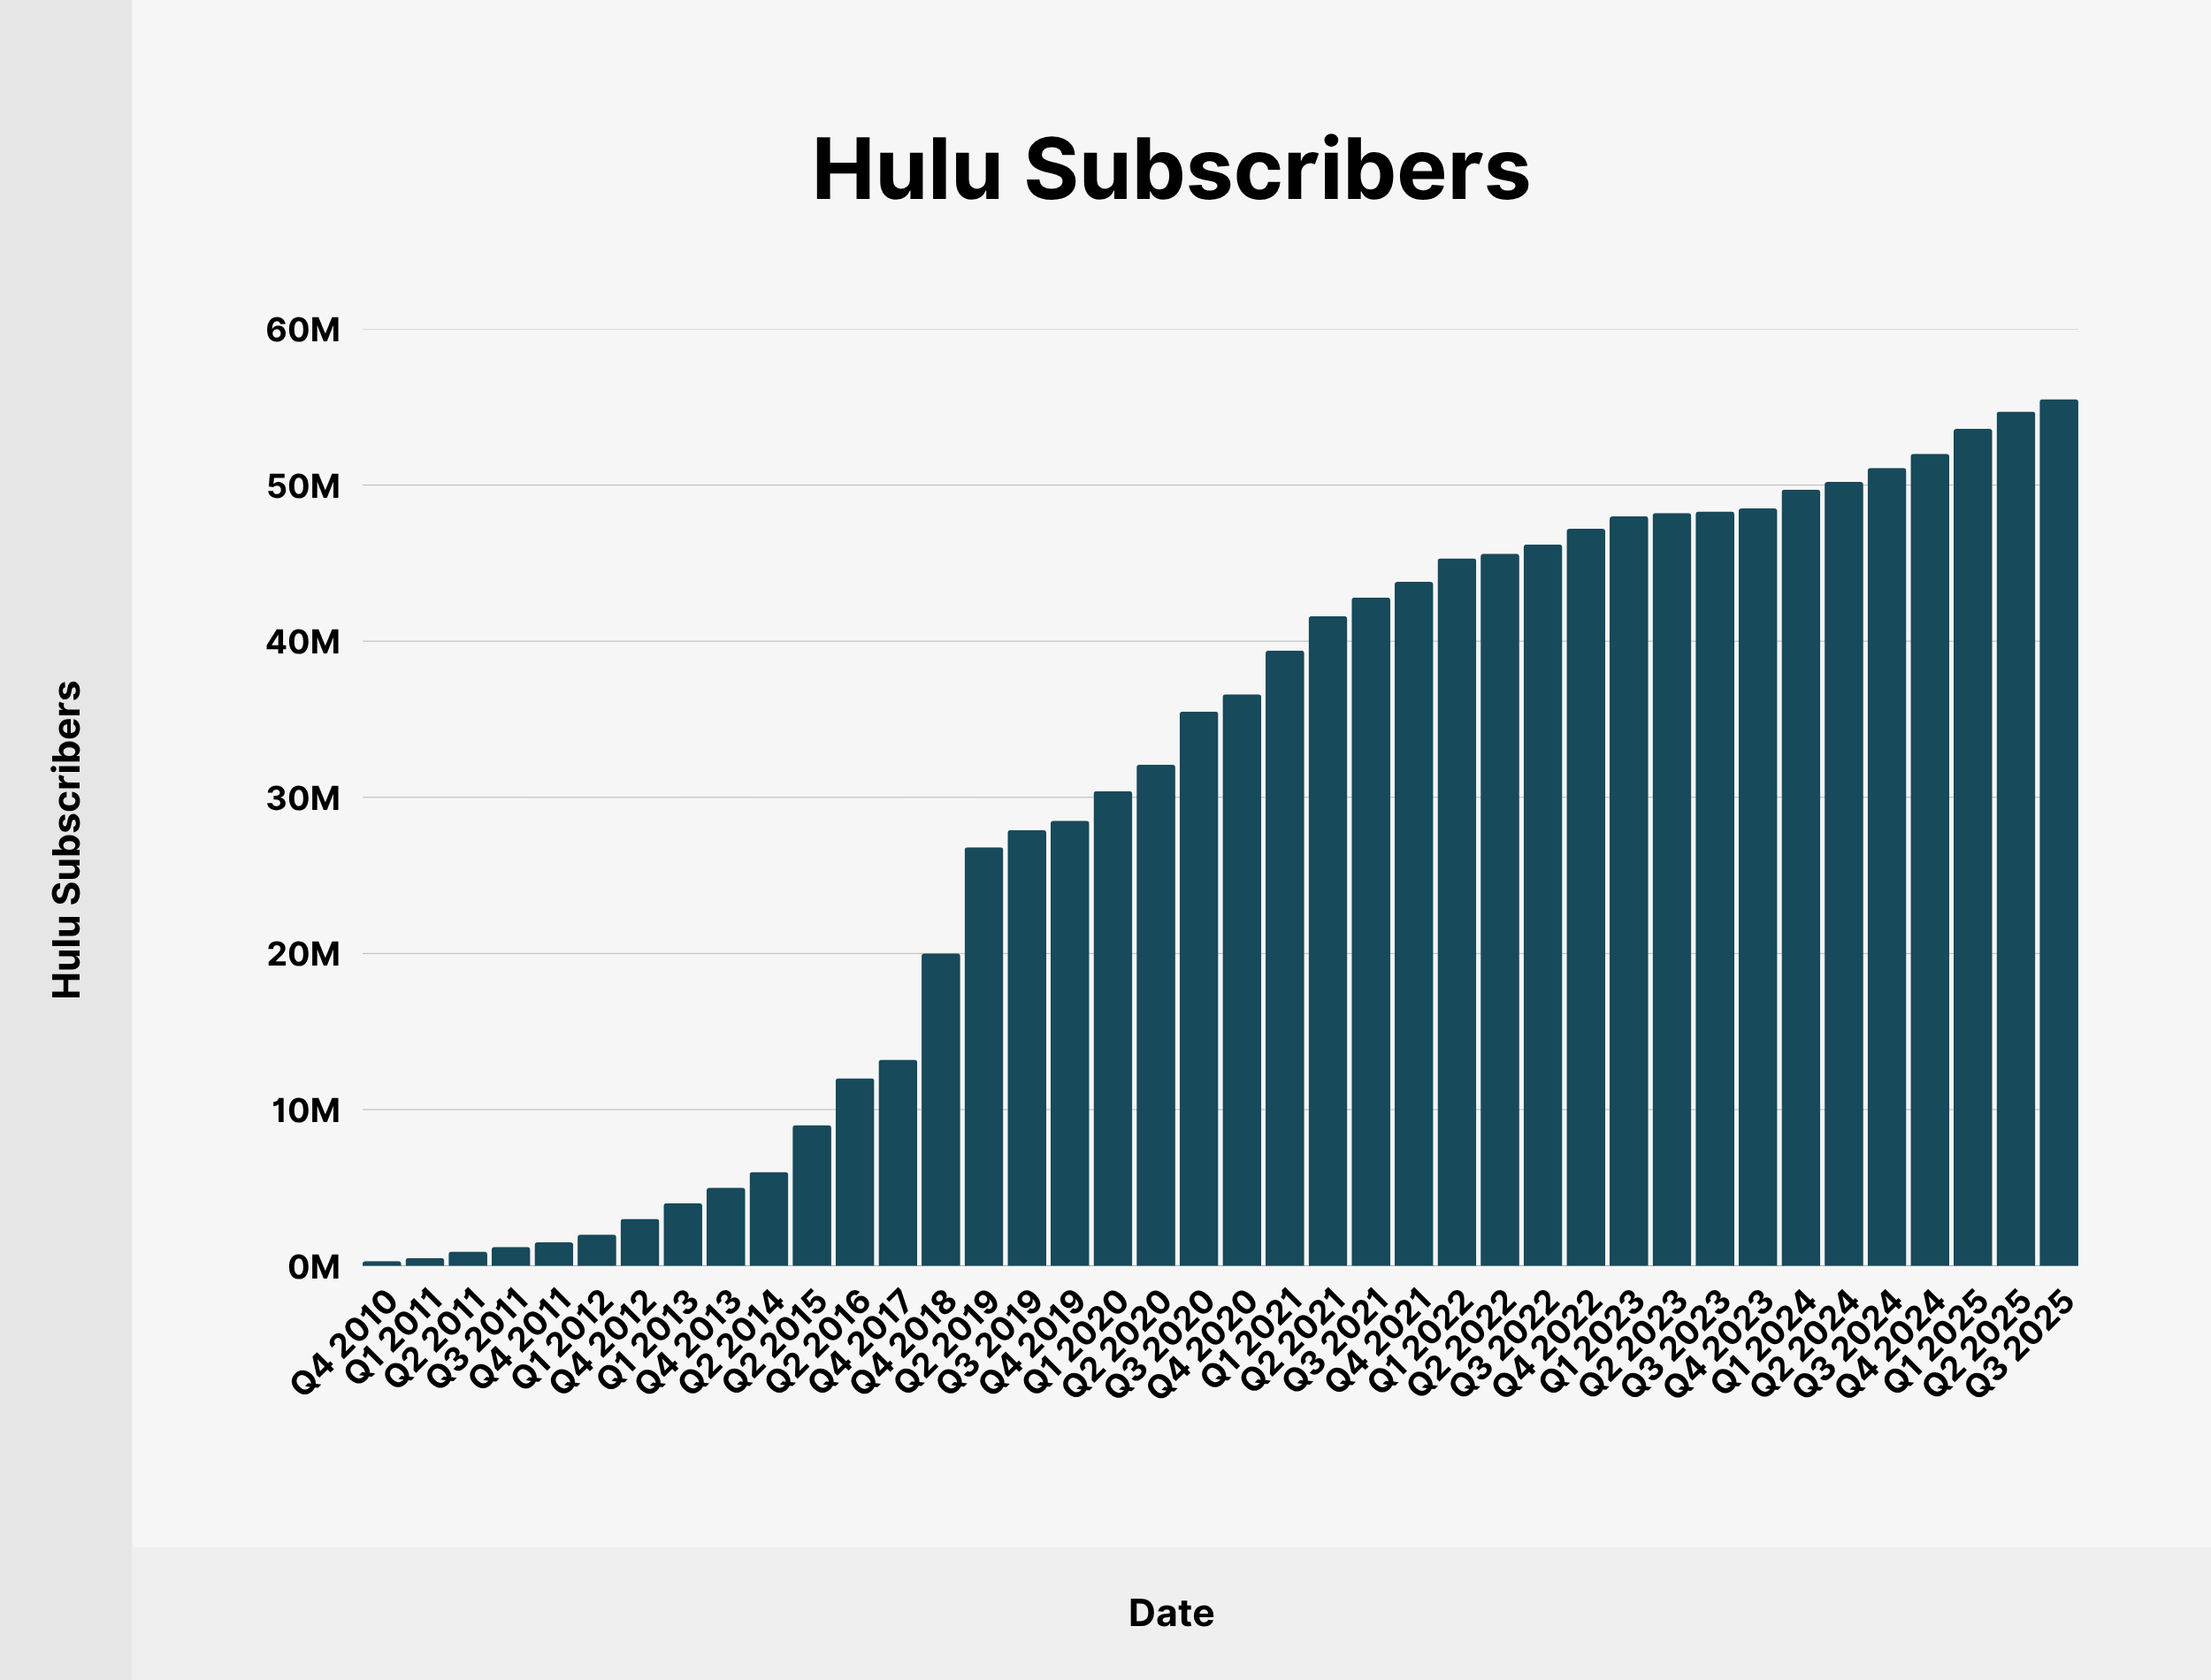
Over the past 3 years, Hulu has added 9.3 million paying users to its subscriber base.
We have charted the growth in Hulu subscribers since 2010:
| Date | Hulu Subscribers |
|---|---|
| Q4 2010 | 300,000 |
| Q1 2011 | 500,000 |
| Q2 2011 | 900,000 |
| Q3 2011 | 1.2 million |
| Q4 2011 | 1.5 million |
| Q1 2012 | 2 million |
| Q4 2012 | 3 million |
| Q1 2013 | 4 million |
| Q4 2013 | 5 million |
| Q2 2014 | 6 million |
| Q2 2015 | 9 million |
| Q2 2016 | 12 million |
| Q4 2017 | 13.2 million |
| Q4 2018 | 20 million |
| Q2 2019 | 26.8 million |
| Q3 2019 | 27.9 million |
| Q4 2019 | 28.5 million |
| Q1 2020 | 30.4 million |
| Q2 2020 | 32.1 million |
| Q3 2020 | 35.5 million |
| Q4 2020 | 36.6 million |
| Q1 2021 | 39.4 million |
| Q2 2021 | 41.6 million |
| Q3 2021 | 42.8 million |
| Q4 2021 | 43.8 million |
| Q1 2022 | 45.3 million |
| Q2 2022 | 45.6 million |
| Q3 2022 | 46.2 million |
| Q4 2022 | 47.2 million |
| Q1 2023 | 48million |
| Q2 2023 | 48.2 million |
| Q3 2023 | 48.3 million |
| Q4 2023 | 48.5 million |
| Q1 2024 | 49.7 million |
| Q2 2024 | 50.2 million |
| Q3 2024 | 51.1 million |
| Q4 2024 | 52 million |
| Q1 2025 | 53.6 million |
| Q2 2025 | 54.7 million |
| Q3 2025 | 55.5 million |
Sources: Business Insider, Statista, Disney
Hulu Subscribers by Plan Tier
As of May 2024, 63% of Hulu subscribers have the ad-supported plan, while the remaining 45% of users have an ad-free plan.
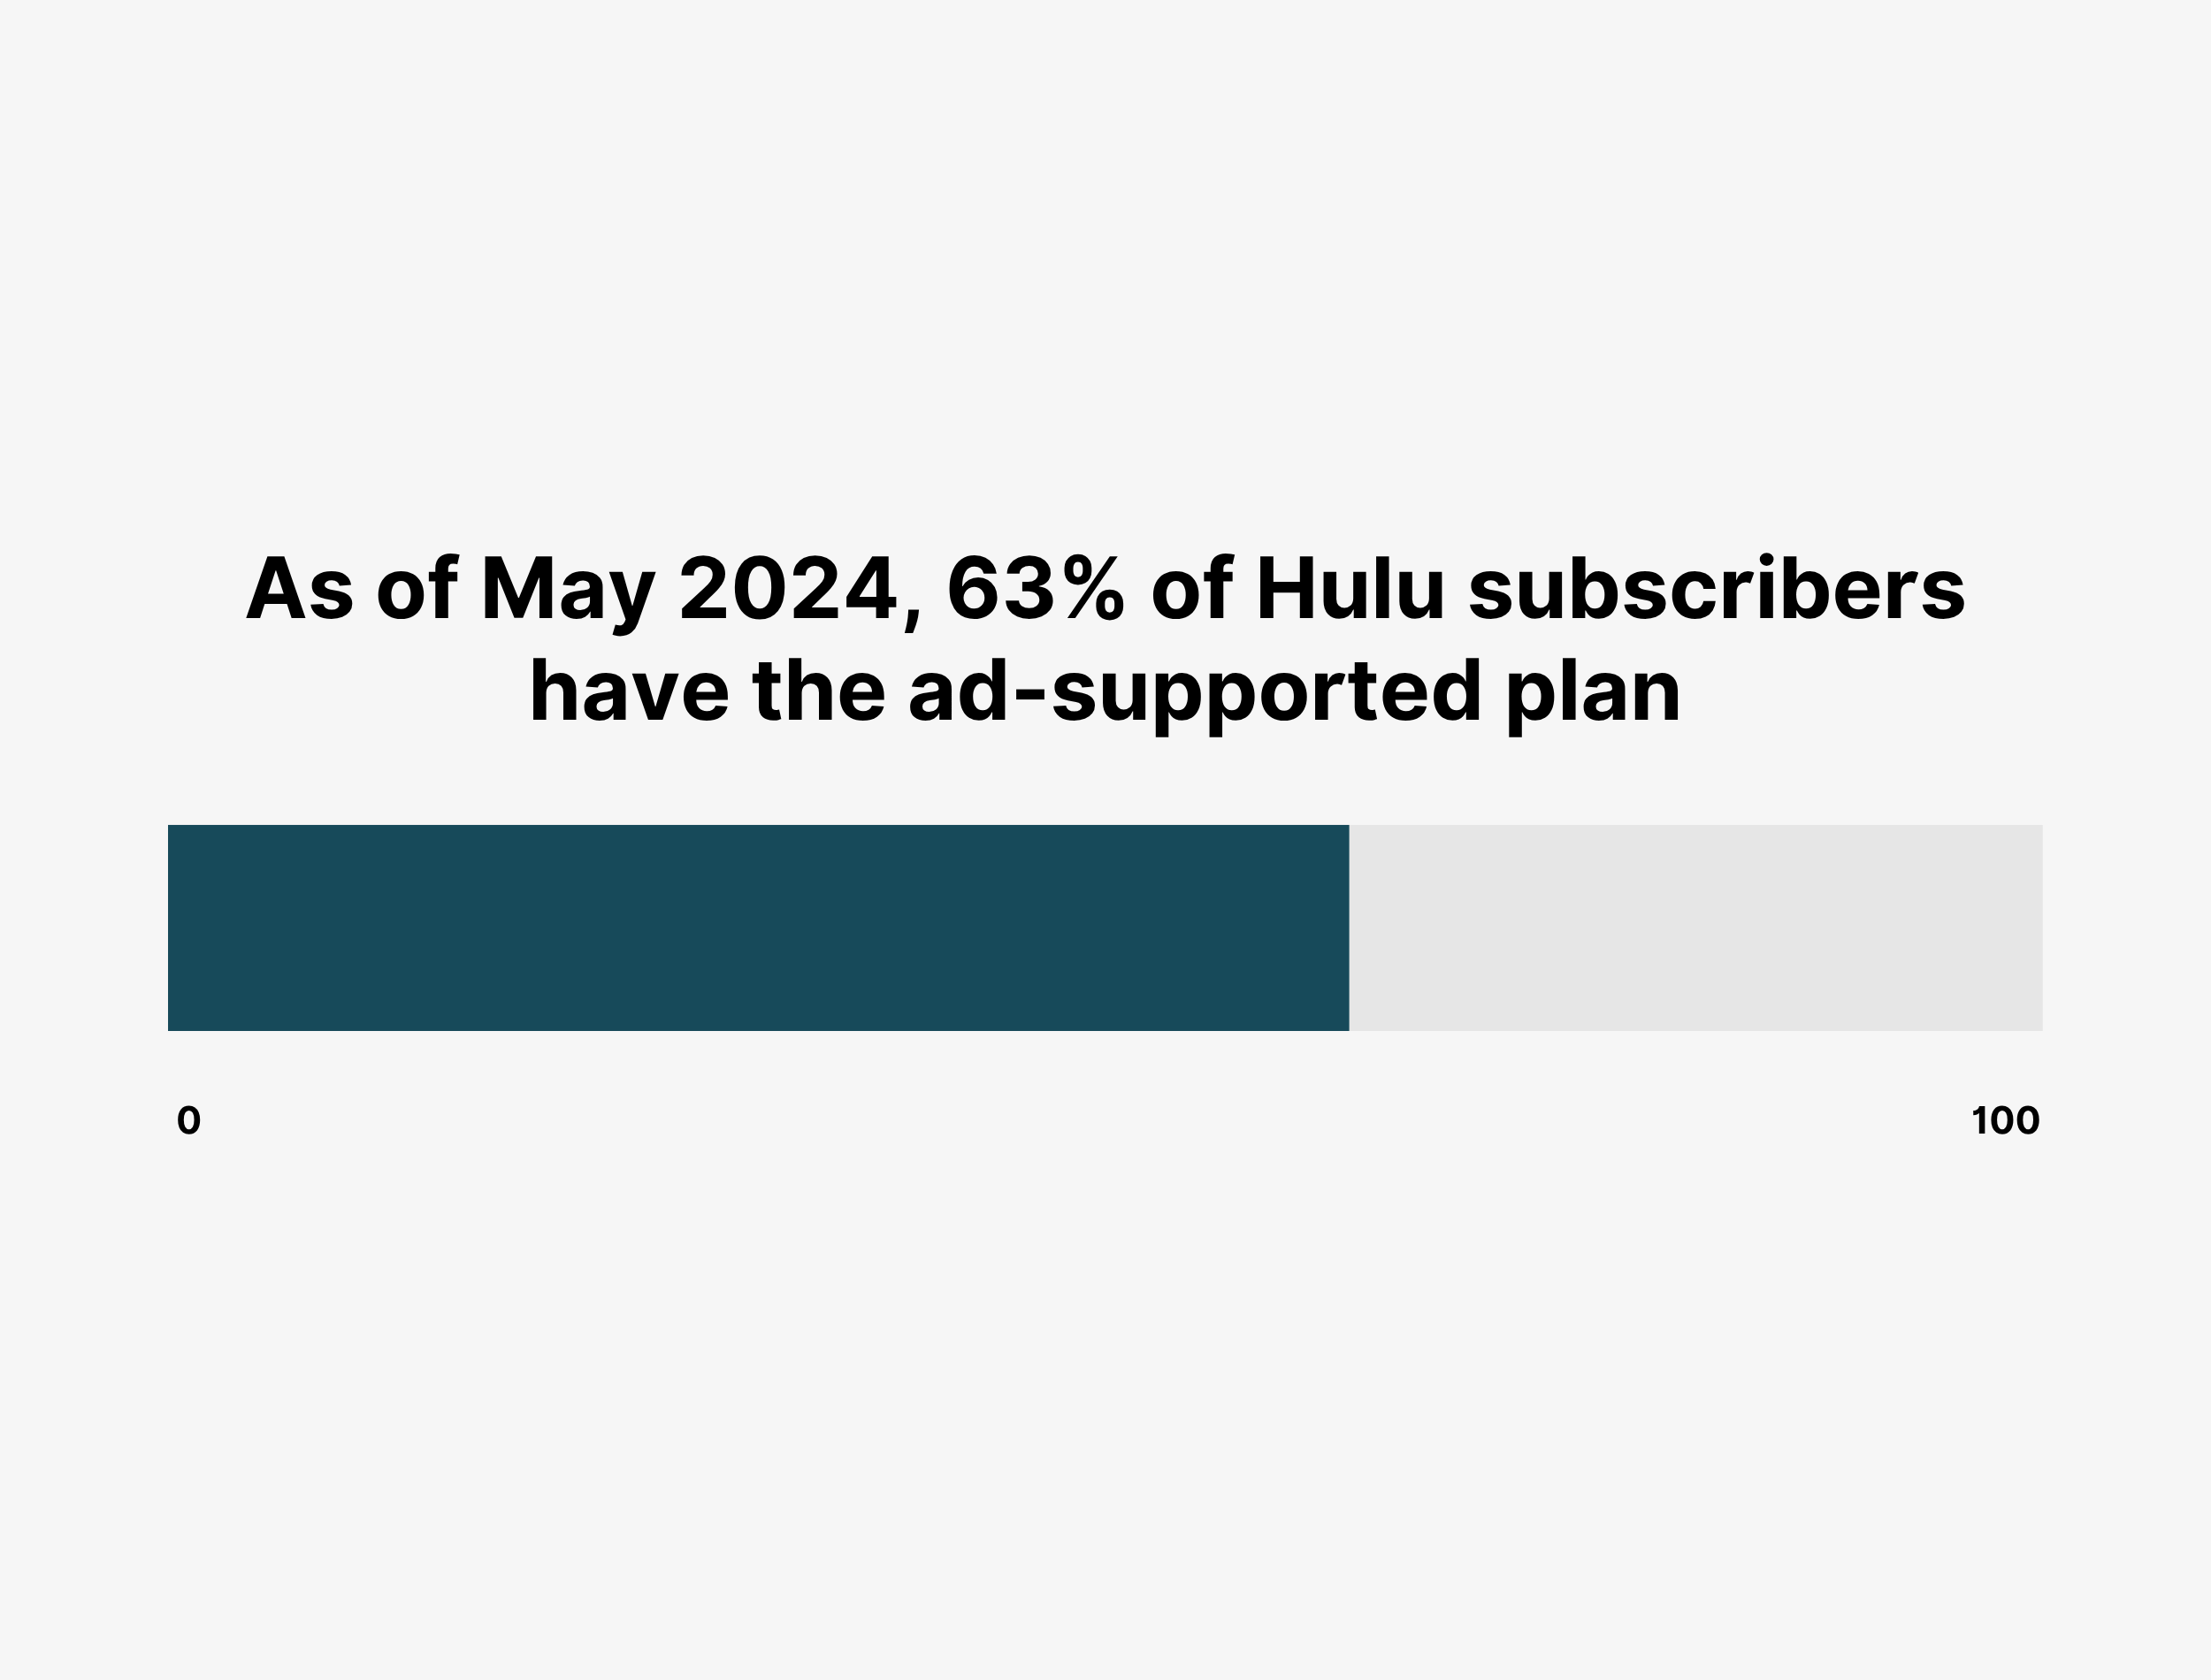
In Q1 2024, 62% of Hulu gross additions opted for an ad-supported plan, while the remaining 38% opted for an ad-free plan.
What Is Hulu’s US Market Share?
Hulu currently has an 11% share of the US subscription video on demand (SVOD) market, calculated by the percentage of total paid subscriptions.
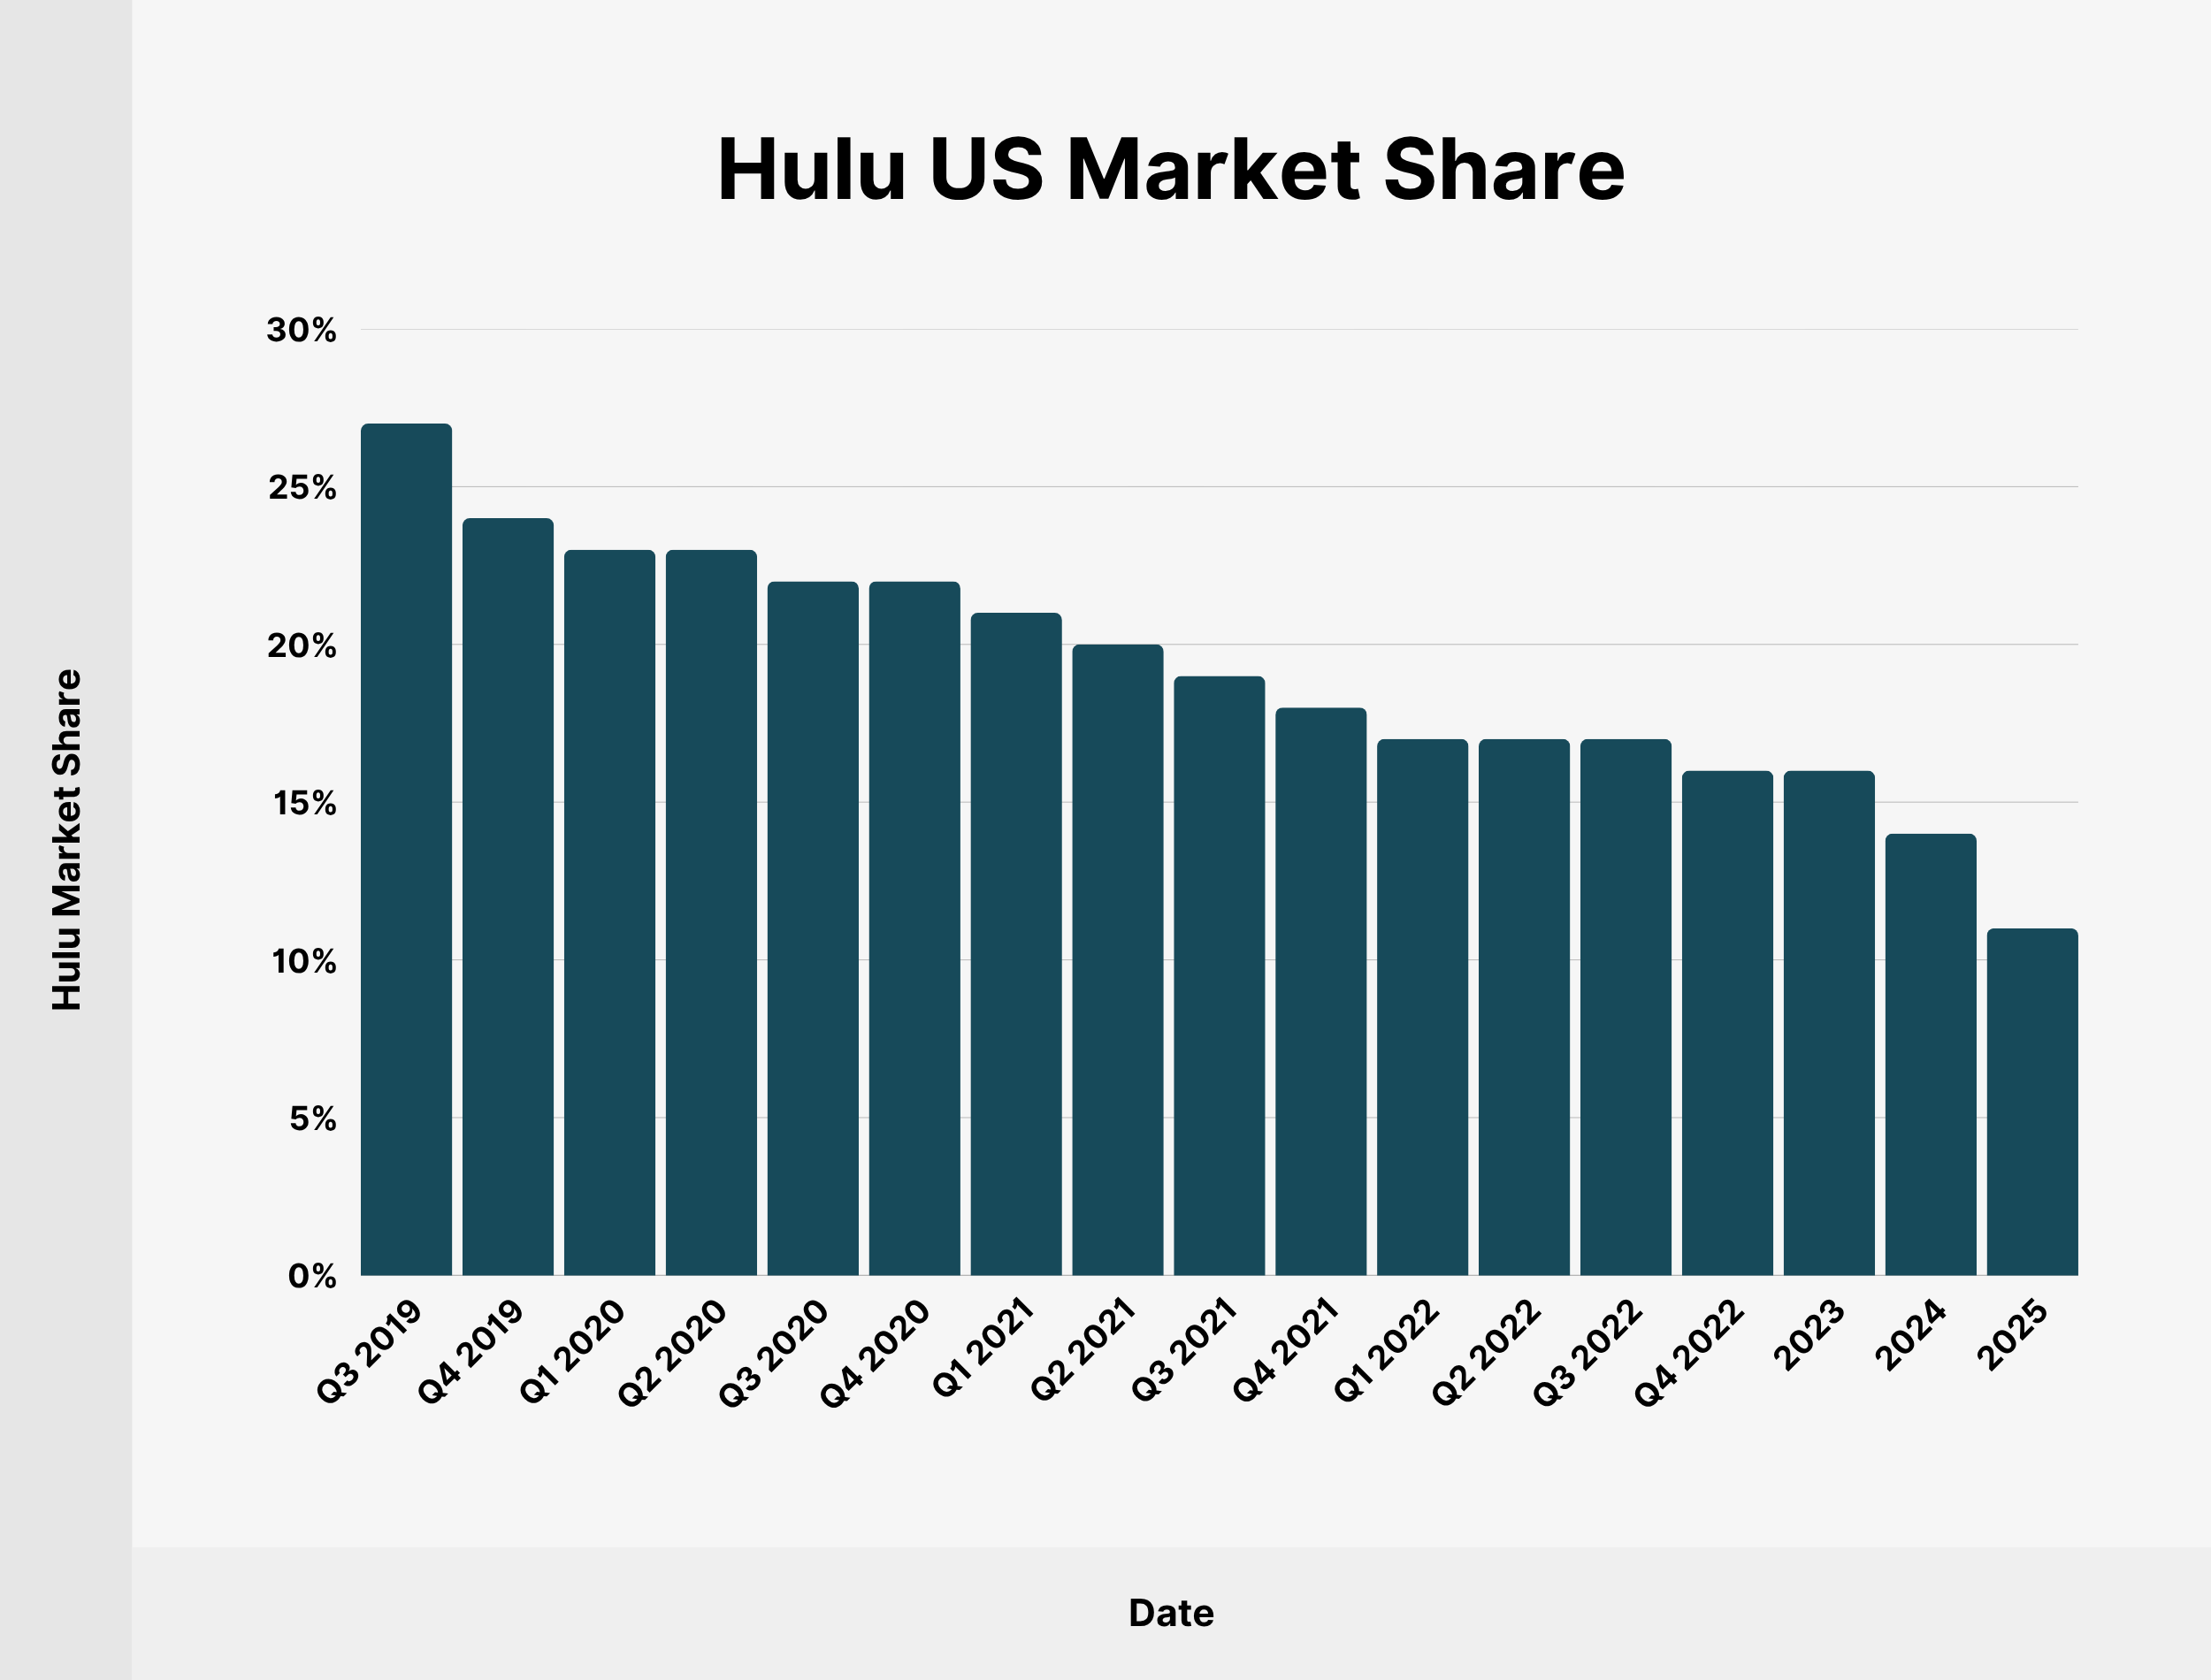
Here’s a table showing Hulu’s share of SVOD subscriptions since Q3 2019:
| Date | Hulu Market Share |
|---|---|
| Q3 2019 | 27% |
| Q4 2019 | 24% |
| Q1 2020 | 23% |
| Q2 2020 | 23% |
| Q3 2020 | 22% |
| Q4 2020 | 22% |
| Q1 2021 | 21% |
| Q2 2021 | 20% |
| Q3 2021 | 19% |
| Q4 2021 | 18% |
| Q1 2022 | 17% |
| Q2 2022 | 17% |
| Q3 2022 | 17% |
| Q4 2022 | 16% |
| 2023 | 16% |
| 2024 | 14% |
| 2025 | 11% |
Source: Antenna
Live TV on Hulu
Hulu’s live TV bundle has 4.4 million subscribers. The package provides access to live programming in addition to the on-demand library.

Here’s a table with the number of Hulu Live TV subscribers since December 2018:
| Date | Hulu Live TV Subscribers |
|---|---|
| December 2018 | 1.7 million |
| December 2019 | 3.2 million |
| March 2020 | 3.3 million |
| June 2020 | 3.4 million |
| October 2020 | 4.1 million |
| January 2021 | 4.0 million |
| April 2021 | 3.8 million |
| July 2021 | 3.7 million |
| October 2021 | 4.0 million |
| January 2022 | 4.3 million |
| April 2022 | 4.1 million |
| July 2022 | 4.0 million |
| October 2022 | 4.4 million |
| December 2022 | 4.5 million |
| April 2023 | 4.4 million |
| July 2023 | 4.3 million |
| September 2023 | 4.6 million |
| December 2023 | 4.6 million |
| March 2024 | 4.5 million |
| June 2024 | 4.5 million |
| September 2024 | 4.4 million |
Source: Disney
Hulu Gender Demographics
52% of Hulu subscribers are female, while the remaining 48% are male. Among rival streaming services, only Netflix can boast a similarly equal gender split (also 52/48).
Source: Morning Consult.
Hulu Subscribers by Generation
More than half (54%) of Hulu subscribers are either millennials or Generation Z.

Here’s a table with the full generational breakdown of Hulu subscribers:
| Generation | Share of Hulu Users |
|---|---|
| Generation Z | 17% |
| Millennials | 37% |
| Generation X | 37% |
| Baby boomers | 19% |
Source: Morning Consult
Hulu Subscriber Political Affiliation
No single political affiliation holds a majority among Hulu subscribers. The Democrats are the largest group, with 43% of subscribers identifying as supporters of the party.
Here’s a breakdown of Hulu subscribers by political party affiliation:
| Political party | Share of Hulu Users |
|---|---|
| Democrats | 43% |
| Independents | 32% |
| Republicans | 25% |
Source: Morning Consult
Where Are Hulu Subscribers From?
The majority (75%) of Hulu subscribers live in urban or suburban communities.

The remaining 25% live outside of towns and cities. Interestingly, this is the largest share of rural viewers among all the major streaming services.
Source: Morning Consult
Hulu Subscriber Race Demographics
64% of Hulu subscribers are white. Only Disney+ (62%) has a lower share of white viewers.

Here’s a breakdown of Hulu subscribers by race:
| Race | Share of Hulu Users |
|---|---|
| White (non-Hispanic) | 64% |
| Hispanic | 20% |
| Black (non-Hispanic) | 13% |
| Asian, other race or ethnicity | 3% |
Source: Morning Consult
Hulu Subscriber Annual Income
Half of Hulu subscribers make less than $50,000 per year.

Among competitors, Netflix has the most comparable income profile. On both services, just 19% of users have an annual income exceeding $100,000. The proportion of affluent subscribers is higher among other rivals.
Source: Morning Consult
Hulu Advertising Revenue
Hulu’s advertising revenue reached an estimated $4.82 billion in 2023. That’s an increase of 23.91% over the previous year.
Based on eMarketer’s market forecast and competitive trends, 2024’s advertised revenue is likely to be around the $5.8 billion mark.
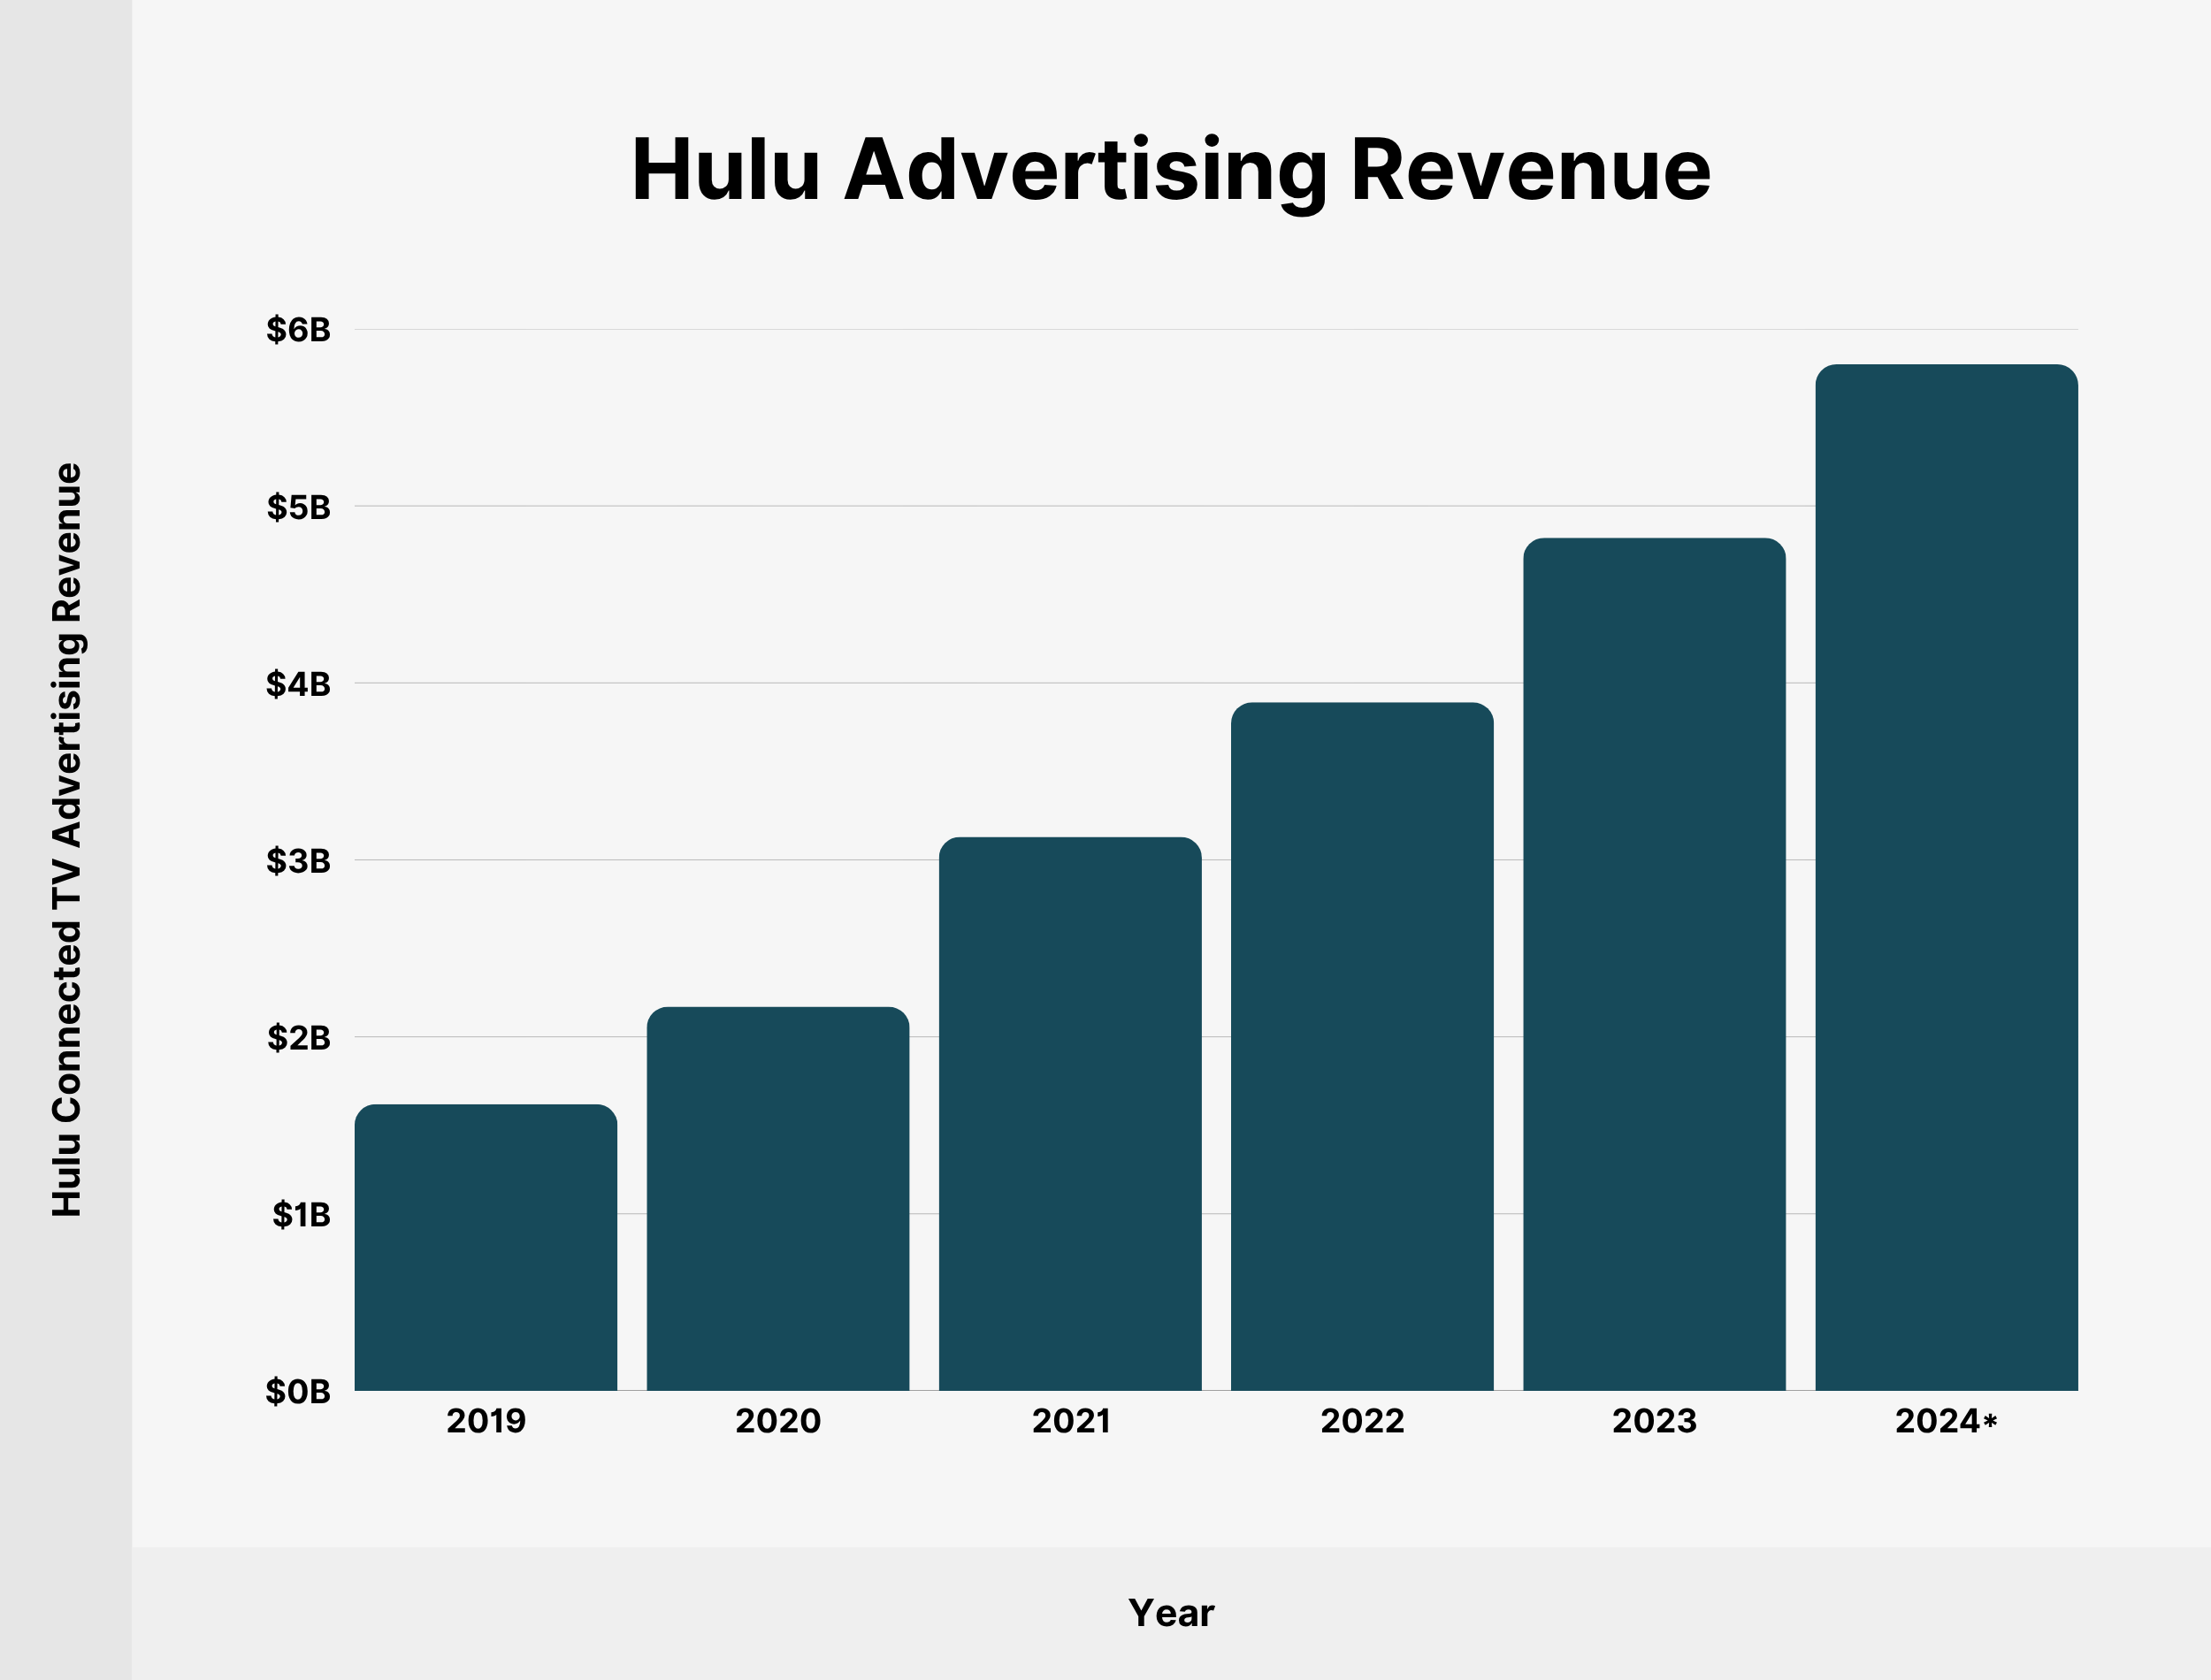
Here’s a table with Hulu’s advertising revenue since 2016:
| Year | Hulu Connected TV Advertising Revenue |
|---|---|
| 2019 | $1.62 billion |
| 2020 | $2.17 billion |
| 2021 | $3.13 billion |
| 2022 | $3.89 billion |
| 2023 | $4.82 billion |
| 2024 | $5.8 billion* |
Source: eMarketer
Hulu’s Average Revenue per Streaming Subscriber
Among paying subscribers without the live TV plan, Hulu reports an average monthly revenue of $12.35 per user.
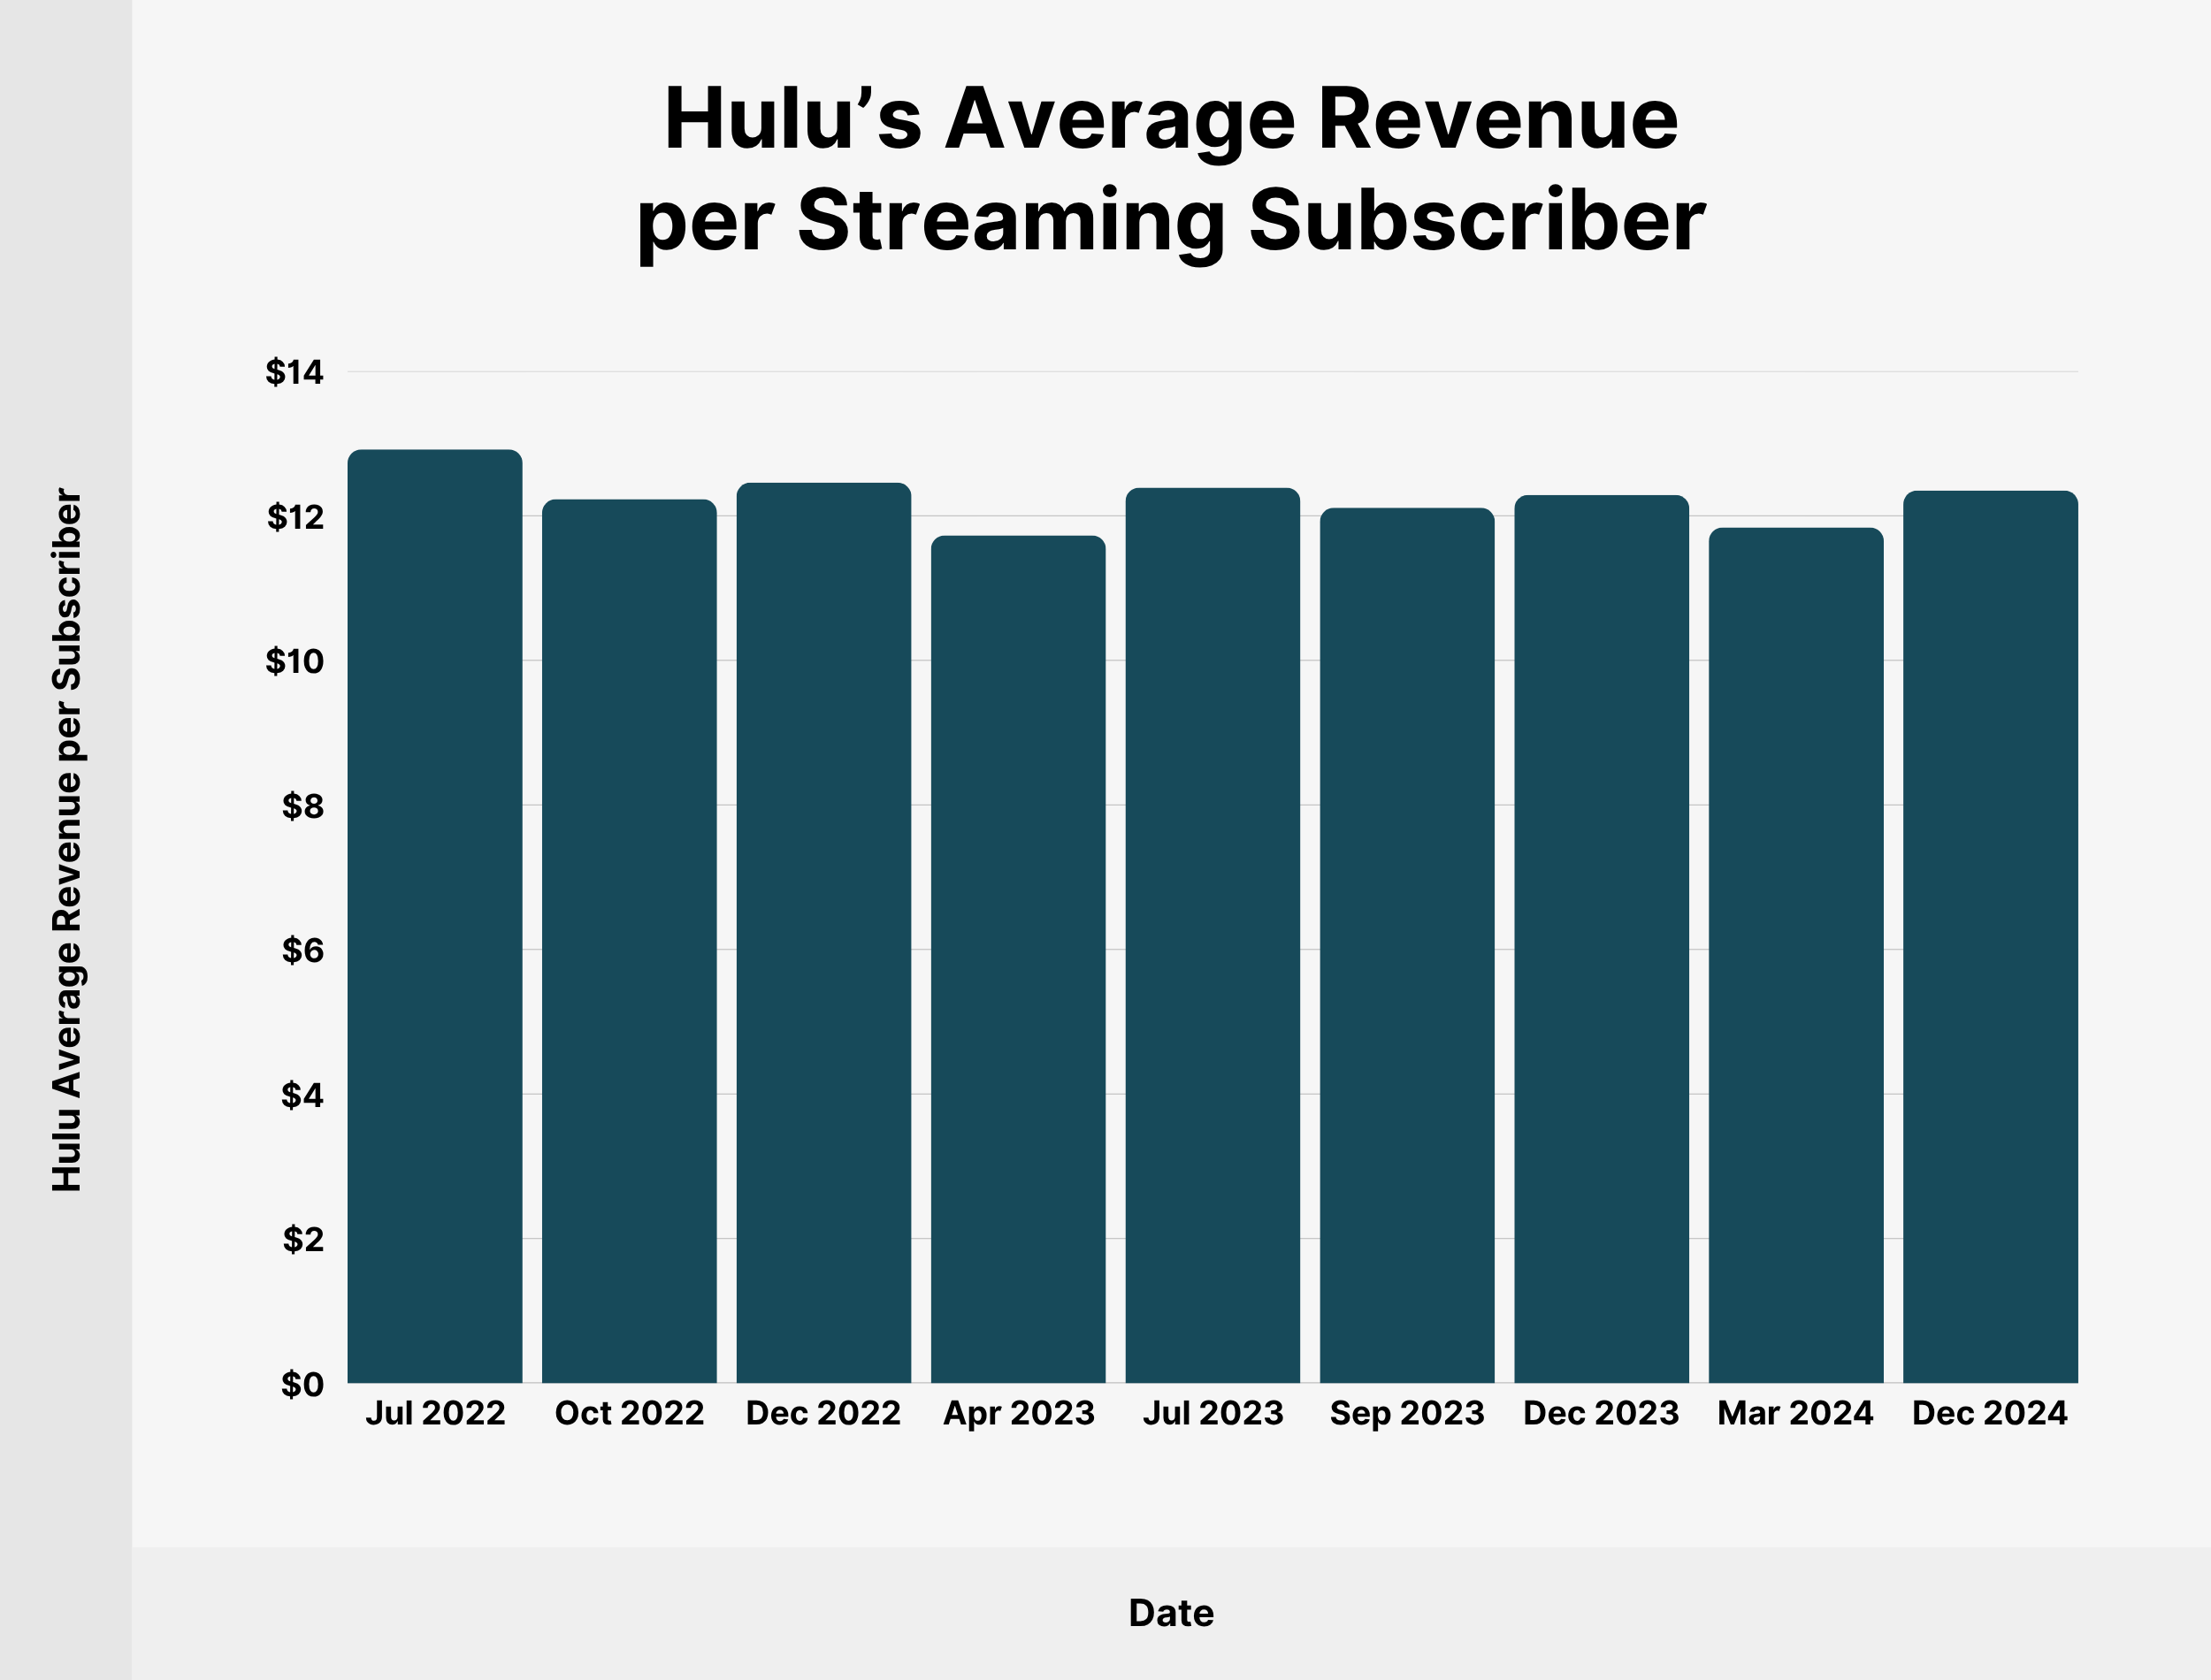
Here’s a table with Hulu’s average revenue per subscriber (without a live plan) since July 2022:
| Date | Hulu Average Revenue per Subscriber |
|---|---|
| July 2022 | $12.92 |
| October 2022 | $12.23 |
| December 2022 | $12.46 |
| April 2023 | $11.73 |
| July 2023 | $12.39 |
| September 2023 | $12.11 |
| December 2023 | $12.29 |
| March 2024 | $11.84 |
| December 2024 | $12.35 |
Source: Disney
Hulu’s Average Revenue per Live TV Subscriber
Live TV bundle subscribers are Hulu’s most lucrative customers. The average revenue per user is 7.7x higher than among streaming-only subscribers.
Among Hulu subscribers with a live TV plan, average monthly revenue per customer reached $95.12 in December 2024, up from $93.61 the previous year.
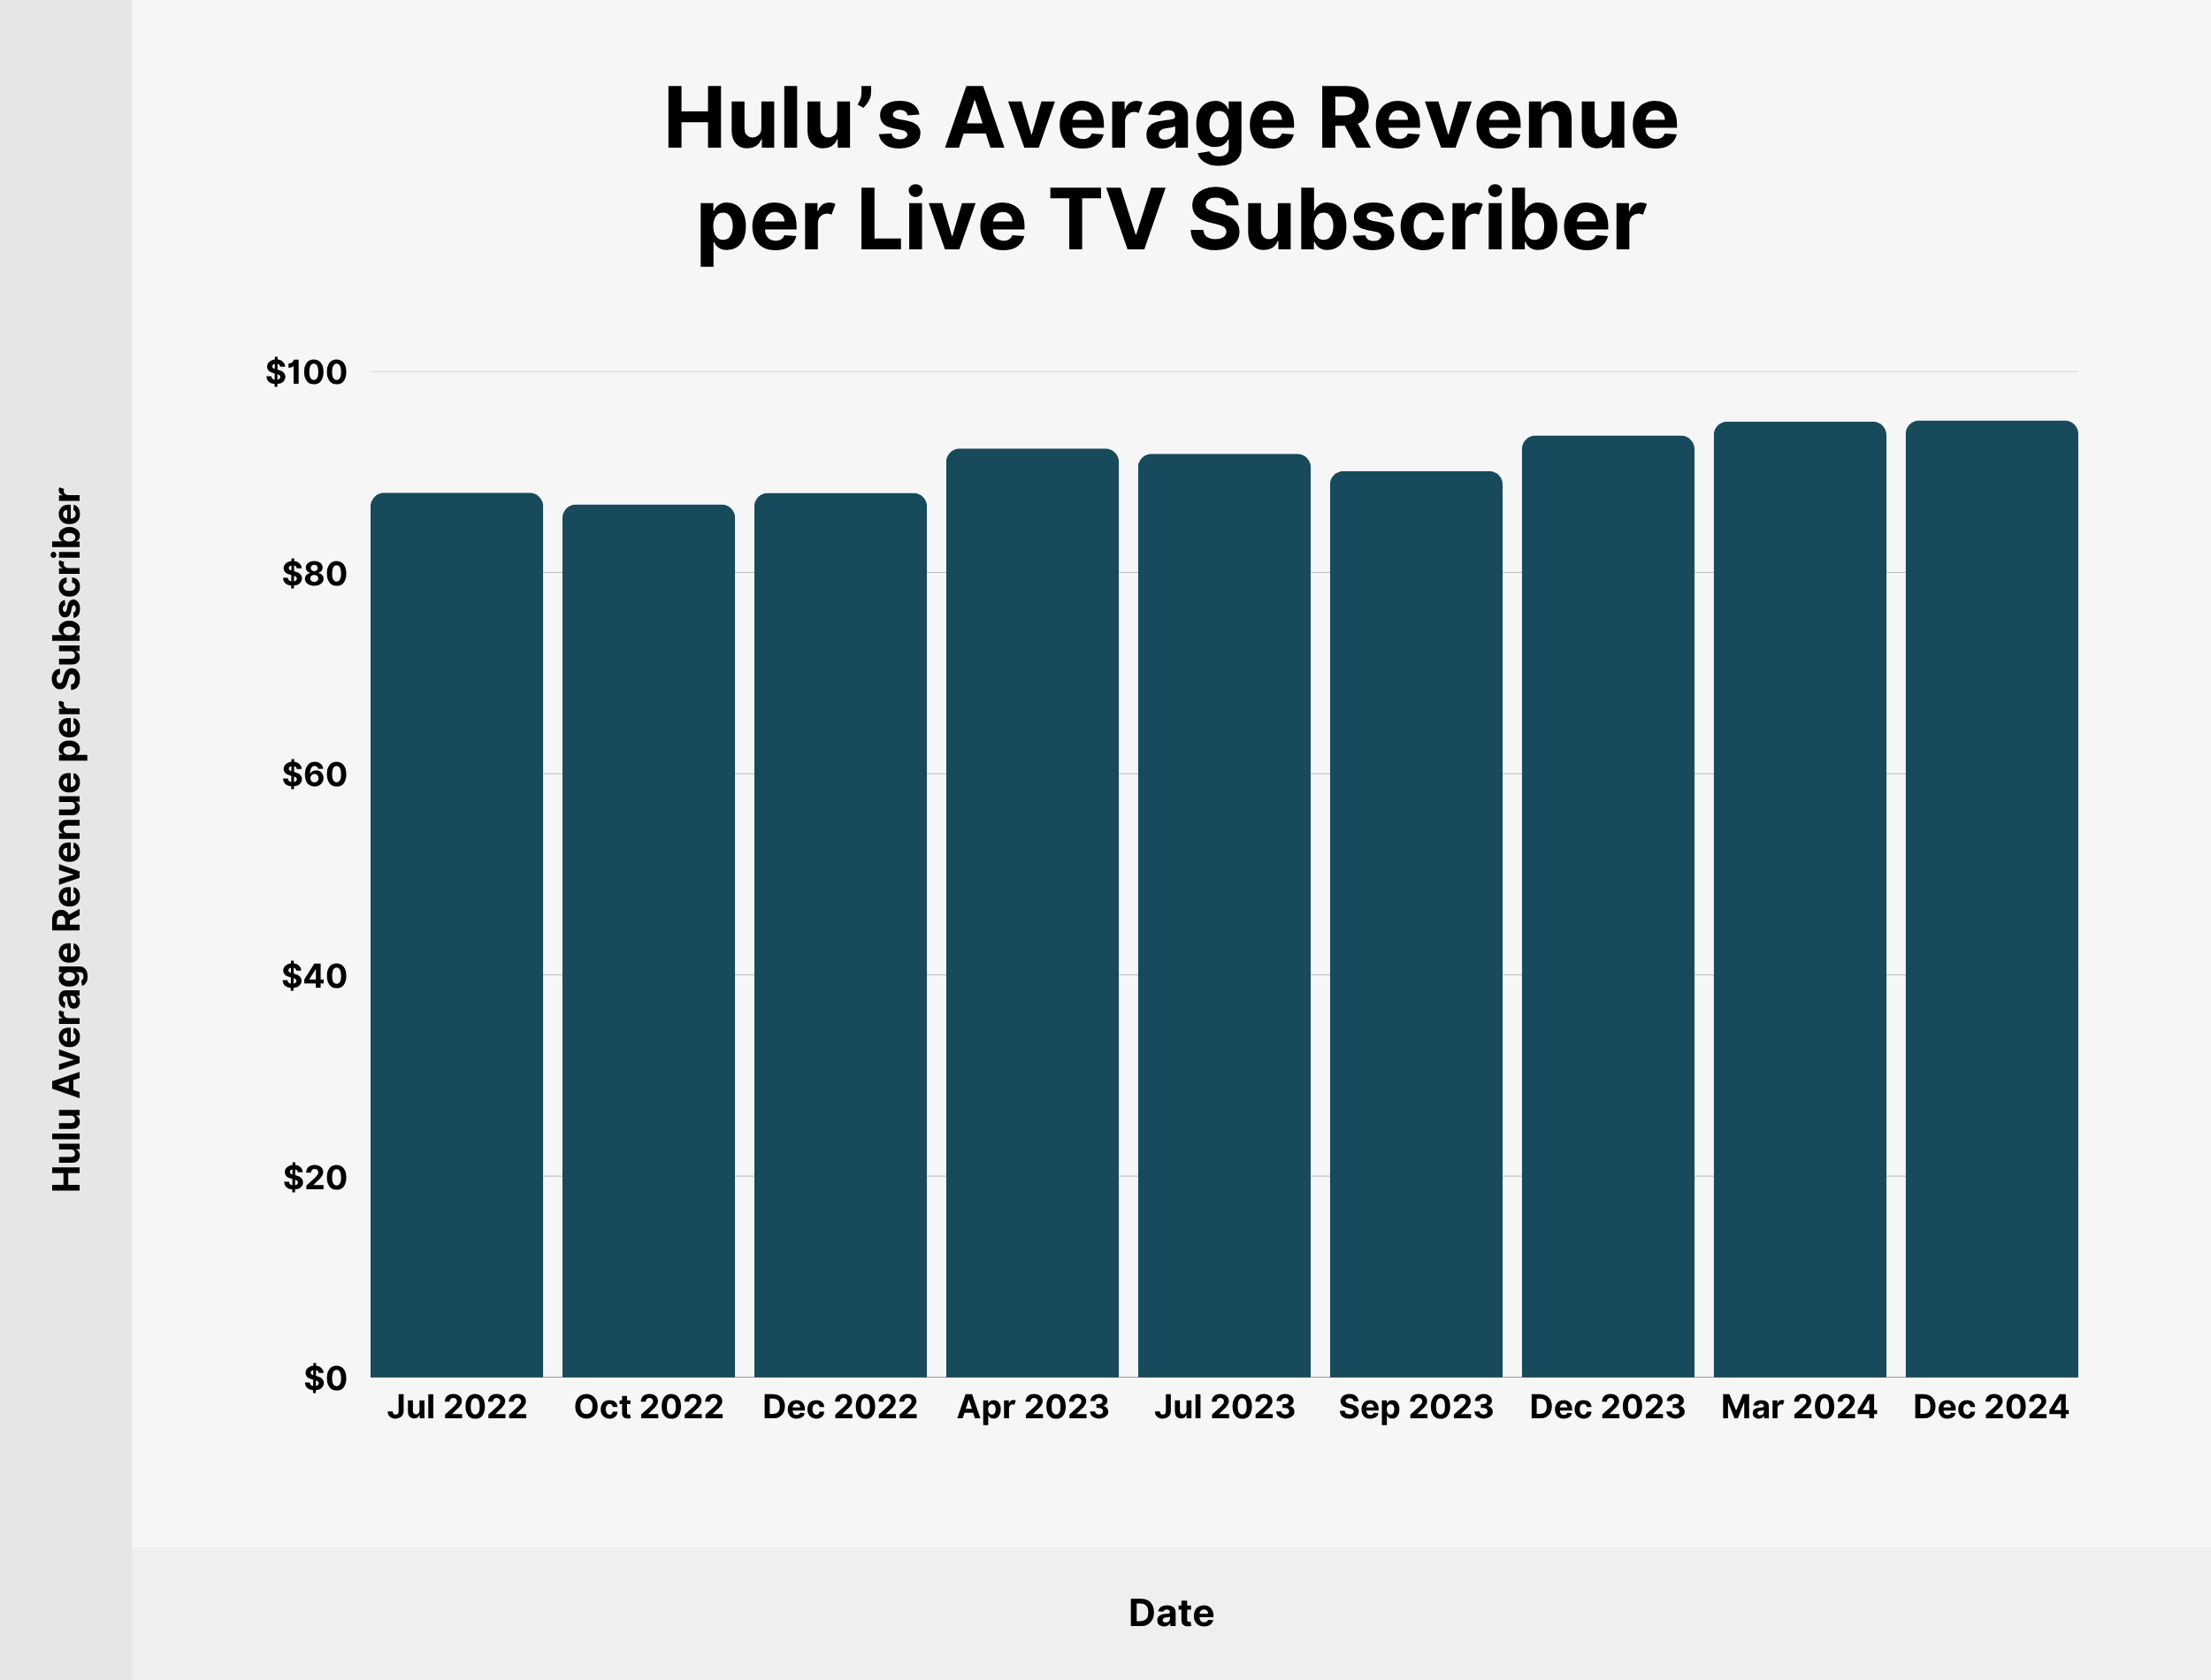
Here’s a table showing Hulu’s average revenue per subscriber (with live TV included in the subscription) since July 2022:
| Date | Hulu Average Revenue per Subscriber |
|---|---|
| July 2022 | $87.92 |
| October 2022 | $86.77 |
| December 2022 | $87.90 |
| April 2023 | $92.32 |
| July 2023 | $91.80 |
| September 2023 | $90.08 |
| December 2023 | $93.61 |
| March 2024 | $95.01 |
| December 2024 | $95.12 |
Source: Disney
Hulu’s Retention Rate
65% of Hulu subscribers with an ad-free plan remain on the platform after 6 months.

The average 6-month retention rate for Hulu subscribers with an ad-supported plan is 63%.
Source: Second Measure.
Hulu Content Library
Hulu’s content library currently contains 7,250 titles (includes distinct movies and TV seasons).

Hulu held 16 of the top 100 most popular titles in the US.
Source: Ampere Analysis
How Many Employees Does Hulu Have?
Hulu has 2,088 US-based employees.
Hulu employees on H1-B visas in the US are reported to receive a median salary of $188,672.
Sources: Great Place To Work, H1B Salary Database
Conclusion
That’s all for my list of Hulu statistics.
Hopefully, you’ve learned something new from this roundup. There are several big players in the streaming game, so it’s interesting to see how Hulu stacks up against the likes of Netflix and Prime Video.
The platform doesn’t share a ton, but I’ve done my best to find facts and figures from multiple sources to provide you with a comprehensive overview.
Backlinko is owned by Semrush. We’re still obsessed with bringing you world-class SEO insights, backed by hands-on experience. Unless otherwise noted, this content was written by either an employee or paid contractor of Semrush Inc.
